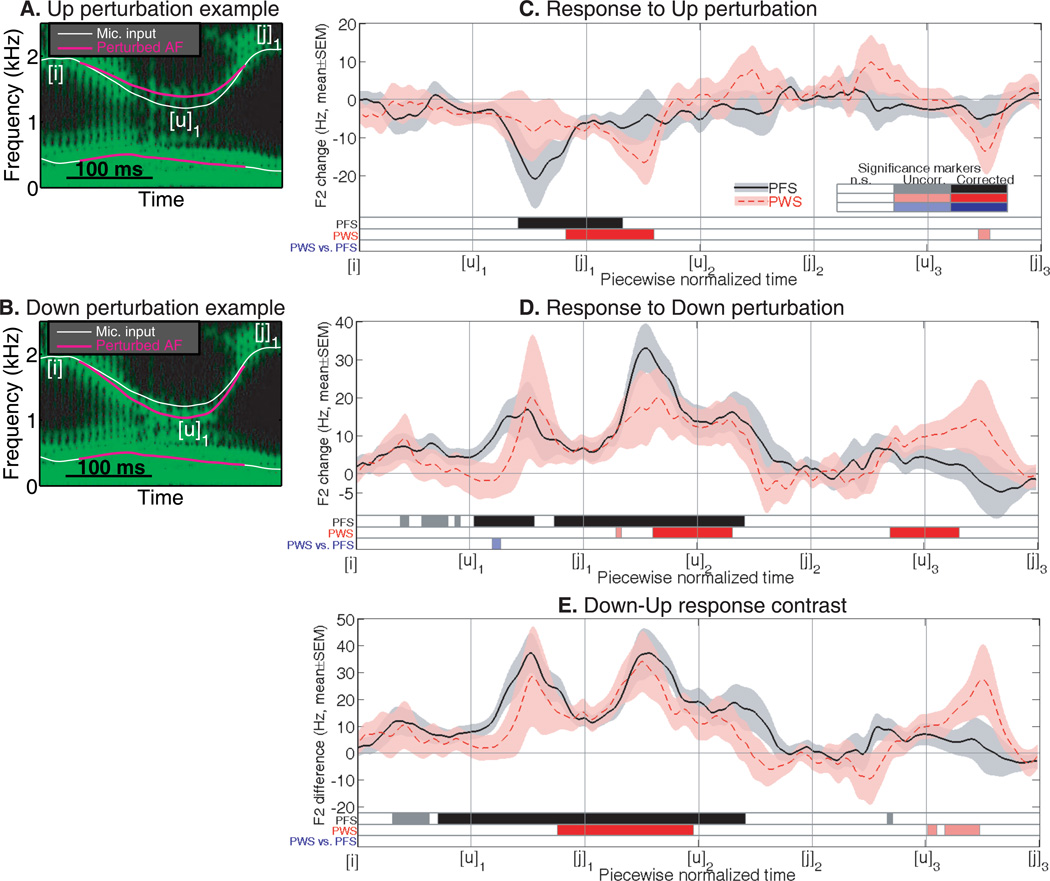
Figure 2.
Perturbations of the spatial parameters of AF: Up and Down. Panels A and B show examples of the Up and Down perturbations. C: Average responses to the Up perturbation in the PFS and PWS groups, shown as group-mean differences between the F2 trajectories produced under the Up and no-perturbation (noPert) conditions. The shading show ±1 standard error of mean (SEM). D: Group-mean responses to the Down perturbation (same format as Panel C). E: Group-mean Down-Up contrast (same format as Panel C). In panels C-E, the three bars at the bottom of each panel indicate the time intervals in which significant differences (corrected and uncorrected) were reached. The top two bars show significance of the F2 changes (from zero) in the PFS and PWS groups, respectively; the bottom bars show the significance of the between-group difference in the F2 change curves. The color coding scheme for statistical significance is illustrated in the “Significance Marker” inset. White: non-significant (n.s.) differences; lighter colors: significance at uncorrected (uncorr.) p<0.05; deeper colors: significance at permutation-corrected p<0.05.

