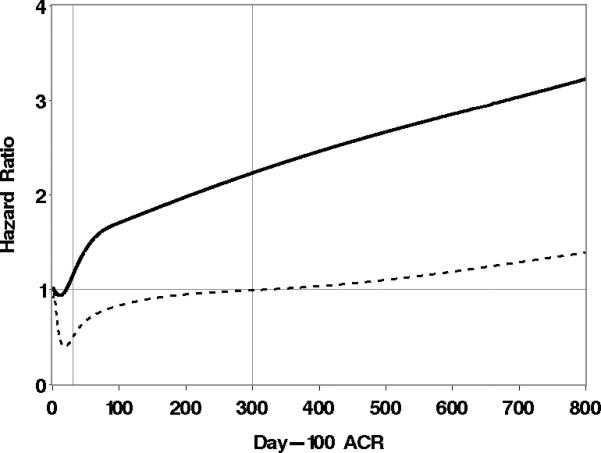
Figure 1.

Association of day-100 ACR with the risk of overall mortality. Day-100 ACR is modeled as a cubic spline, and each point on the solid curve represents the hazard of death for the associated ACR value relative to the hazard of death at an ACR level of 2.6, which is the 5th percentile of day-100 ACR values. The dotted curve represents point-wise lower 95% confidence limits. The 5th, 25th, 50th, 75th, and 95th percentiles (the knots for the cubic spline) are 2.6, 10, 30.4, 95.6, and 715.7, respectively.
