
Figure 2.
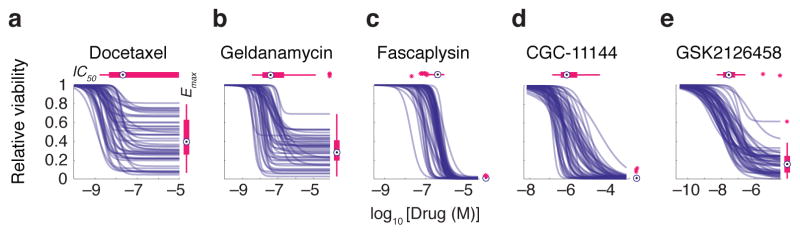
Selected examples of dose-response curves representing different types of variation in dose-response relationships. Patterns of dose-response across the breast cell line panel for (a) docetaxel, a microtubule stabilizer, (b) geldanamycin, an HSP90 inhibitor, (c) fascaplysin, a CDK4 inhibitor, (d) CGC-11144, a polyamine analogue, and (e) GSK2126458, a PI3K inhibitor are shown. These drugs are highlighted in red in Fig. 1c. The range of IC50 and Emax values is represented by box and whisker plots drawn and median parameter values and inter-quartile ranges shown above and to the right; bars extending to 1.5-times the inter-quartile range are shown for each drug as a measure of variance. Parameter values for outlier cell lines are denoted by stars.