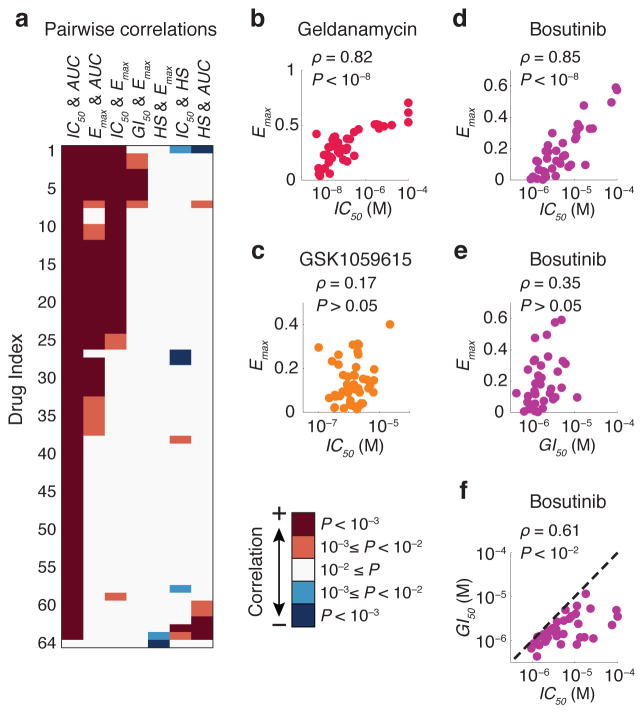
Figure 3.
Different dose-response parameters do not always correlate with each other. (a) Pairwise correlation between different key dose-response parameters estimated for each drug across the breast cancer cell line collection. P values were corrected using the Bonferroni-Holm method. A complete view of panel (a) including drug names corresponding to each drug index is presented in Supplementary Fig. 1. Correlation coefficient values and corrected P values are presented in Supplementary Data Set 3. (b, c) Pairwise distribution and correlation of Emax and IC50 for geldanamycin (an HSP90 inhibitor) and GSK1059615 (a PI3K inhibitor). (d–f) Pairwise distribution and correlation of Emax, IC50 and GI50 for bosutinib (a Src/Abl inhibitor) across the cell line panel. Each circle represents a cell line. Colors represent different drugs.

