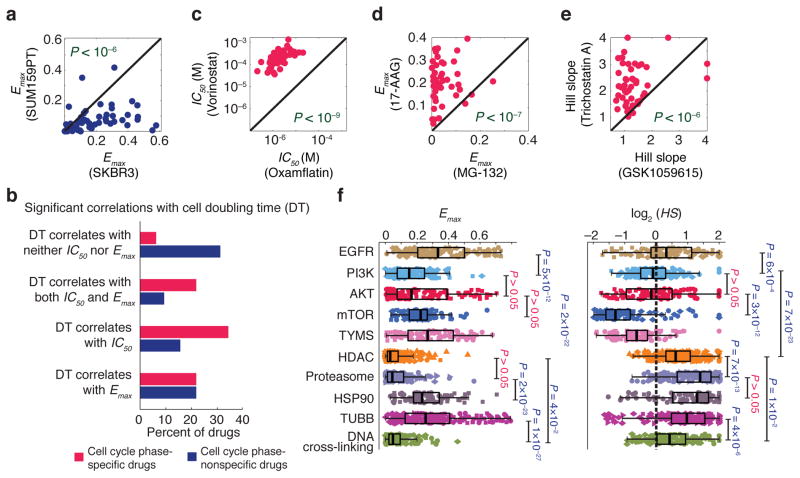
Figure 4.
Association of dose-response parameters with cell type, drug type and drug class. (a) An example showing that two cell lines (SUM159PT and SKBR3) are distinguishable by Emax values with SUM159PT cells having lower values for all but three compounds. Significance of difference between the Emax values for the two cell lines was evaluated by a P value based on nonparametric Wilcoxon signed rank test. (b) Correlation between different dose-response parameters estimated for the set of anti-cancer compounds and the doubling times across the breast cell lines. Drugs are grouped in two groups: cell cycle phase-specific and –nonspecific drugs. See Supplementary Fig. 2 for the complete list of drugs in each group. The percentage of drugs within each group that exhibit significant correlation (P < 0.05) between doubling time and parameters Emax and IC50 is shown. P values were corrected using the Benjamini-Hochberg method. Correlation coefficient values and corresponding P values are presented in Supplementary Data Set 4. (c–e) Three examples of anti-cancer drugs that are distinguishable based on dose-response parameter values across the breast cell line panel as discovered by mutual information analysis. The Significance of differences between drugs was evaluated by P values based on nonparametric Wilcoxon signed rank test. (f) Variation of Emax and Hill slope for different classes of drugs defined based on target or mechanism of action across the breast cell lines. Significance of differences between drug classes was evaluated by P values based on nonparametric Mann-Whitney U test and corrected using Bonferroni-Holm method.

