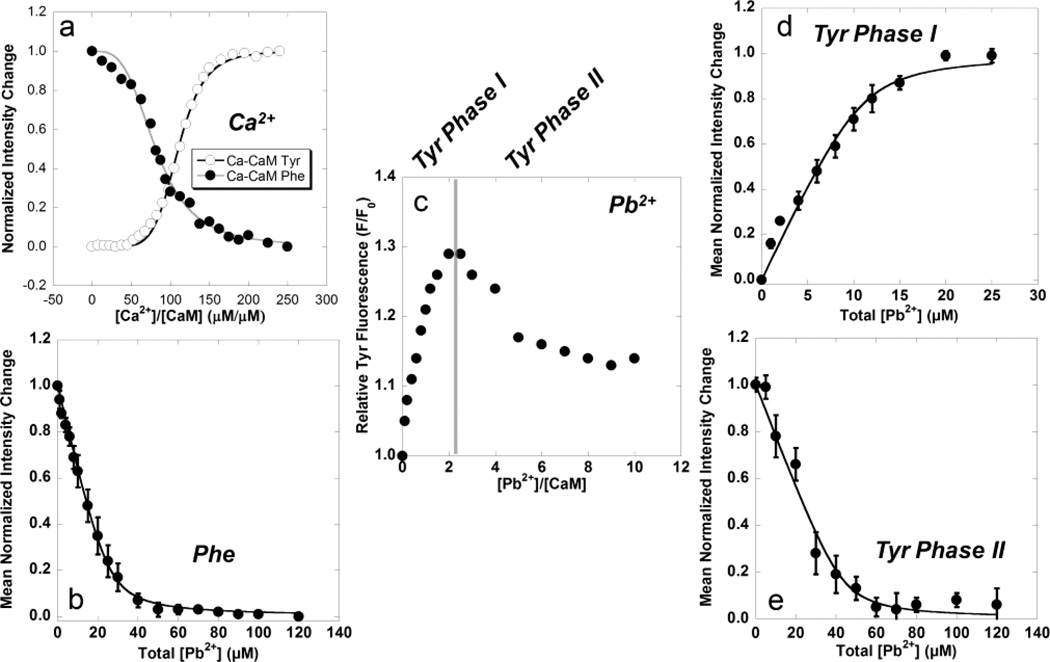
Fig. 1.
(a) Mean normalized Tyr (○) and Phe (●) fluorescence changes as a function of total [Ca2+] using Eq. 4. (b) Mean normalized Phe fluorescence change as a function of total [Pb2+] for the N-terminal domain with calculated Kd of 1.40 ± 0.30 µM. (c) Relative Tyr fluorescence as a function of Pb2+:CaM complex formation. The observed biphasic fluorescent response is divided into (d) Phase 1 with a calculated Kd of 0.73 ± 0.10 µM and (e) Phase 2 with a calculated Kd of 1.93 ± 0.32 µM. The calculated Kd for Phase 2 of the Tyr fluorescence falls within the standard deviation calculated for Phe fluorescence in the N-terminal domain.

