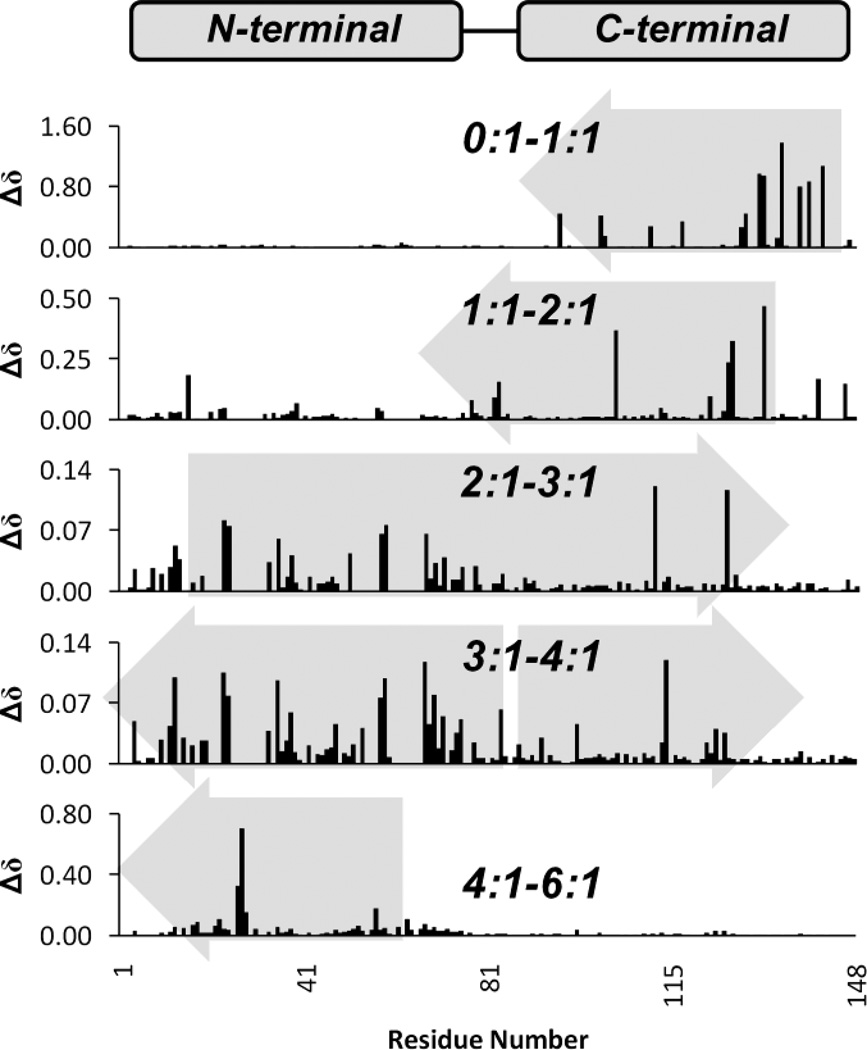
Fig. 4.
Absolute changes in δ between successive points in the titration of Ca2+ to CaM, where changes are expressed in molar ratios of Ca2+:CaM (0:1–6:1). Viewed from top to bottom, Δδ values indicate binding of Ca2+ first in the C-terminal domain, followed by the N-terminal domain. Additionally, binding in one domain affects structural changes in the other. The gray arrows indicate direction of changes.

