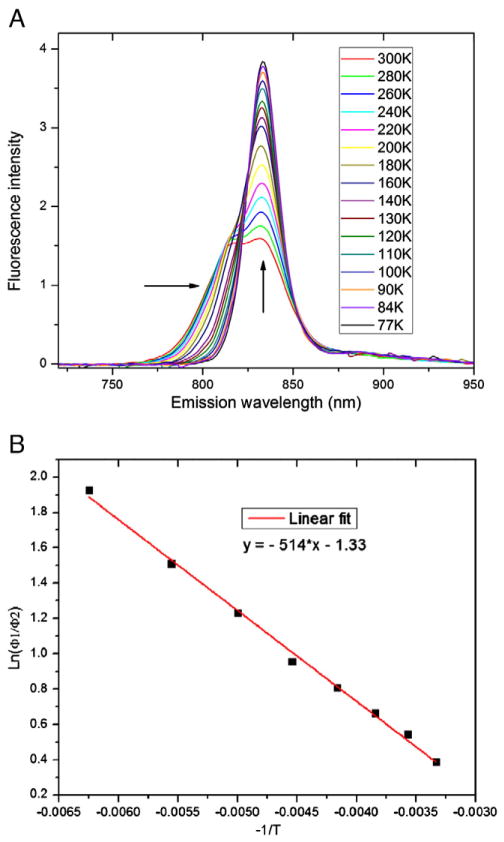
Fig. 5.
(A) Temperature-dependent fluorescence emission spectra recorded at 300 to 77 K. Arrows indicate the narrowing of the bandwidth and the increase of the intensity. (B) A plot of the ratio of the fluorescence yields of the two emission peaks versus the reciprocal of temperature from 160 to 300 K; the solid red line is a linear fit of the data.

