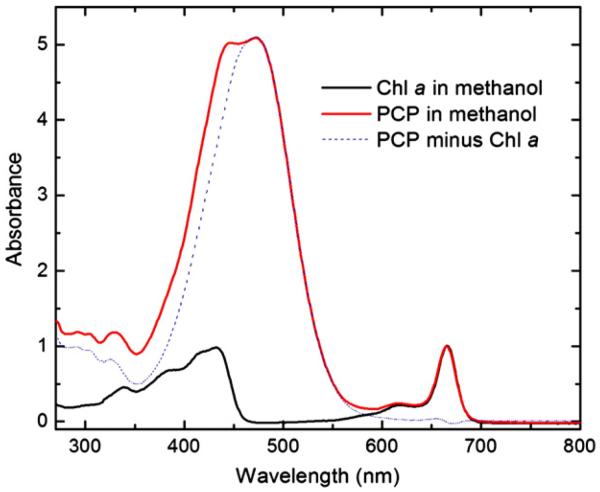
Fig. 8.
The spectra of the PCP methanol extract (solid red) and Chl a (in methanol) (solid black), normalized at Chl a Qy band. The difference between the solid red line and the solid black is indicated by the dotted blue line, which matches the shape of peridinin absorption spectrum. The contribution of Chl a absorbance at 469 nm was deducted from the PCP methanol extract absorbance at the same wavelength.

