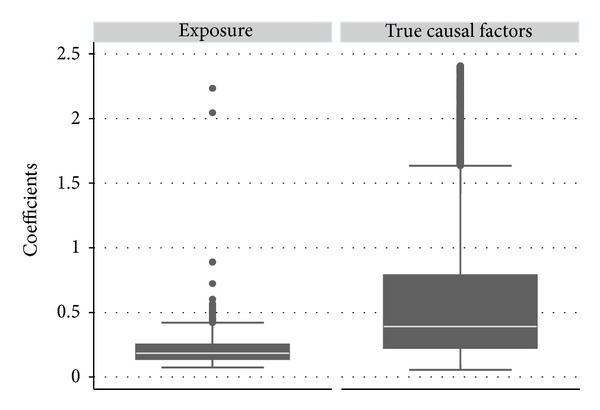
Figure 1.

Difference in estimate distributions between the exposure and the real component causes. The upper and lower adjacent lines indicate the upper and lower adjacent values, respectively; the upper and lower edges of the boxes indicate 75th percentiles and 25th percentiles, respectively; and the white lines in the boxes indicate the medians. (The upper limit of the graph is set to 2.409, the 95th percentile for coefficients of the real component causes).
