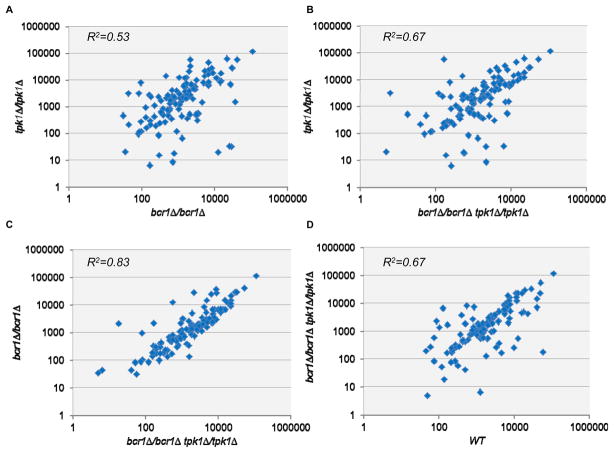
Figure 3. Relationship between Tpk1 and Bcr1 in gene expression.
Expression data was generated by nanoString measurement (Table S1) using probes for 117 genes. RNA levels for each gene were normalized to internal control TDH3 RNA levels, and the mean of three biological replicates for each gene was plotted here. (A) Normalized gene expression in a bcr1Δ/bcr1Δ strain (x-axis) versus a tpk1Δ/tpk1 strain (y-axis). (B) Normalized gene expression in a bcr1Δ/bcr1Δ tpk1Δ/tpk1 strain (x-axis) versus a tpk1Δ/tpk1 strain (y-axis). (C) Normalized gene expression in a bcr1Δ/bcr1Δ tpk1Δ/tpk1 strain (x-axis) versus a bcr1Δ/bcr1Δ strain (y-axis). (D) Normalized gene expression in a wild-type strain (x-axis) versus a bcr1Δ/bcr1Δ tpk1Δ/tpk1 strain (y-axis). The strains used were DAY185, CJN702, SF1151, and SF1130.

