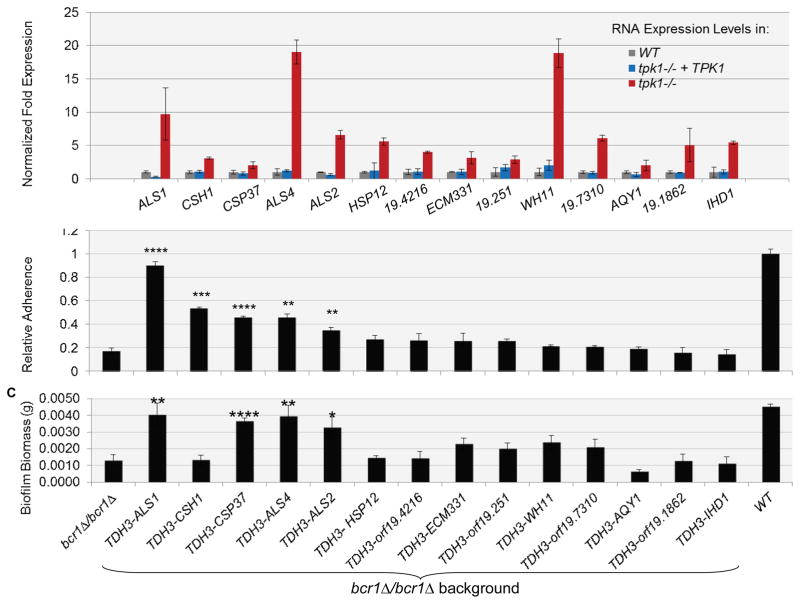
Figure 4. Effect of Tpk1 target genes on adherence and biofilm formation in a bcr1Δ/ bcr1Δ background.
(A) Gene expression measurements for the 14 most highly Tpk1-repressed identified by microarray analysis. The bar graph shows results of QRTPCR assays that were conducted in triplicate samples of the wild type, complemented, and mutant strains. The strains used were DAY286, JJH384, and JJH233. (B and C) Each of the most highly Tpk1-repressed genes was overexpressed from the TDH3 promoter in a bcf1Δ/bcr1Δ background, and strains were assayed for (B) adherence, using a Fluxion flow assay, and (C) biofilm biomass. Error bars represent standard deviation. Statistical significance is relative to bcr1Δ/bcr1Δ. *p≤0.05, **p≤0.005, ***p≤0.001, ***p≤0.0005. The strains used were DAY185, CJN702, SF1255, SF1258, SF1303, SF1294, SF1259, SF1300, SF1284, SF1264, SF1253, SF1275, SF1257, SF1297, and SF1295.

