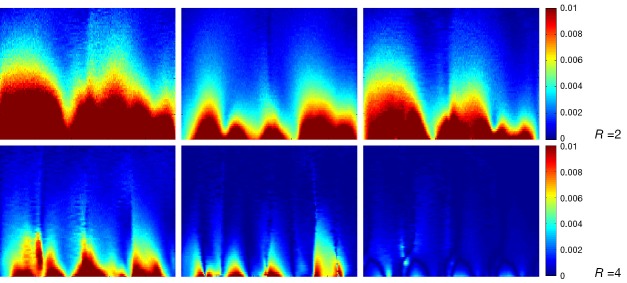
Figure 13.

SNR maps of the arrays by Cov-rSoS reconstruction with Gaussian noise [(mean =0, std =1×10⁻⁸)]. Left, 8-ch CMDM; Middle, 4-ch DM; Right, 4-ch CM. SNR, signal-to-noise ratio; CMDM, common-mode differential-mode; Cov-rSoS, covariance weighted root-sum-of-squares.
