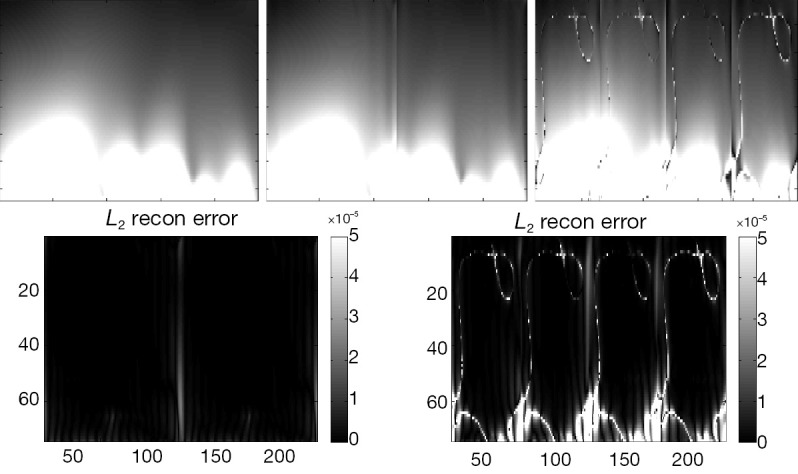
Figure 5.

The image and reconstruction error of SENSE at various reduction factor for 4-channel DM array. The top row demonstrates the image corresponding to reduction factor R =1, 2, 4. The bottom row displays the L2 error between reconstruction images and covariance weighted root-sum-of-squares for reduction factor R =2, 4. SENSE, sensitivity encoding; DM, differential-mode.
