
Figure 2.
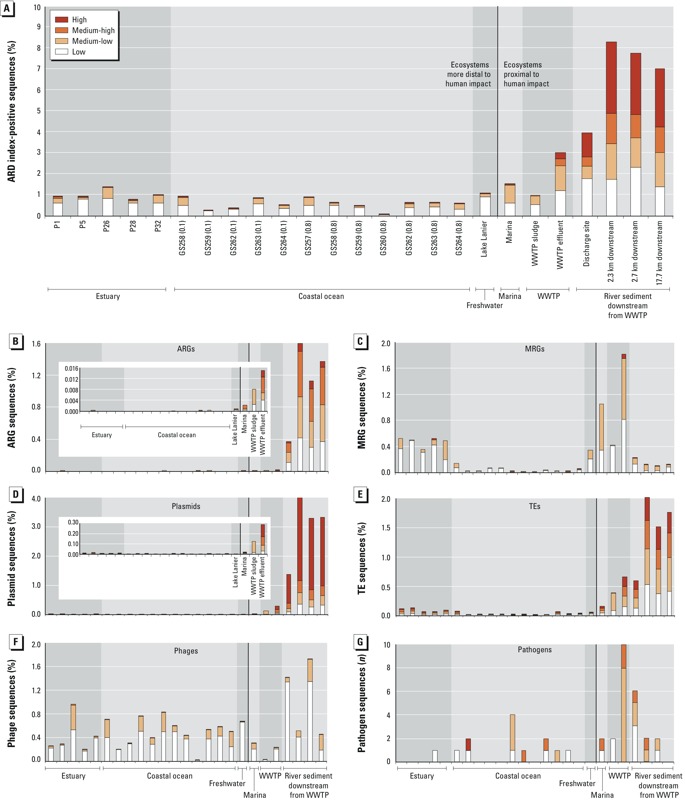
Percentage of total sequenced reads per metagenome assigned to the ARD index. (A) Percentage of index-positive sequences per sample and ecosystem and (B–G) the percentage of sequence reads per sample and ecosystem assigned to each index subcategory [(B) ARG sequences; (C) MRG sequences; (D) plasmid sequences; (E) TE sequences; (F) phage sequences; (G) pathogen sequences]. The percentages are shown for four different sequence similarity thresholds [including high, medium-high, medium, and low stringencies (see Table 2)]. The number of pathogen-annotated sequences is shown instead of the percentage. The vertical bar in each plot separates ecosystems more distal versus more proximal to human impact. Filter sizes (i.e., 0.1 and 0.8 μm) are listed after the station names for the coastal ocean samples. The graph inserts for ARGs and plasmids in B and D are zoomed-in views of the abundance of each subcategory excluding the river sediment samples.