
Figure 3.
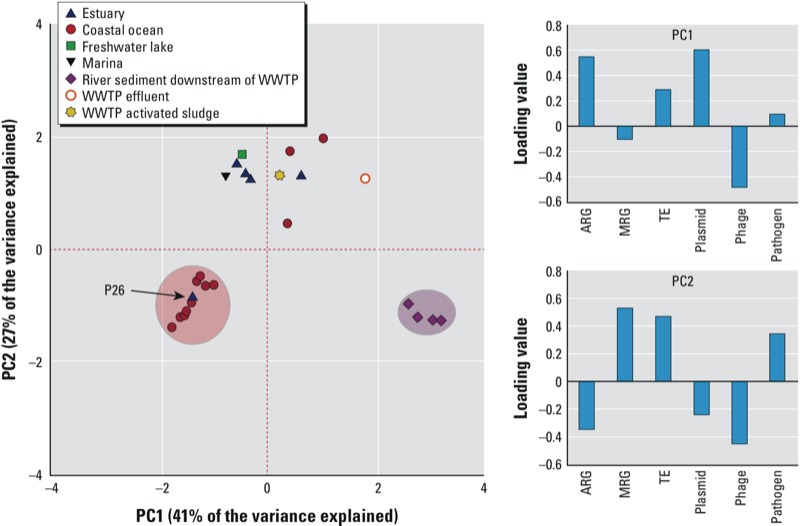
PCA score plot and corresponding loading values for the index subcategories by ecosystem. The medium-high sequence similarity threshold was used for this analysis (see Table 2). Sampling location P26 experiences increased mixing of oceanic waters relative to the other estuary samples. The red and purple circles indicate distinct coastal ocean and river sediment sample clusters, respectively, according to PC1.