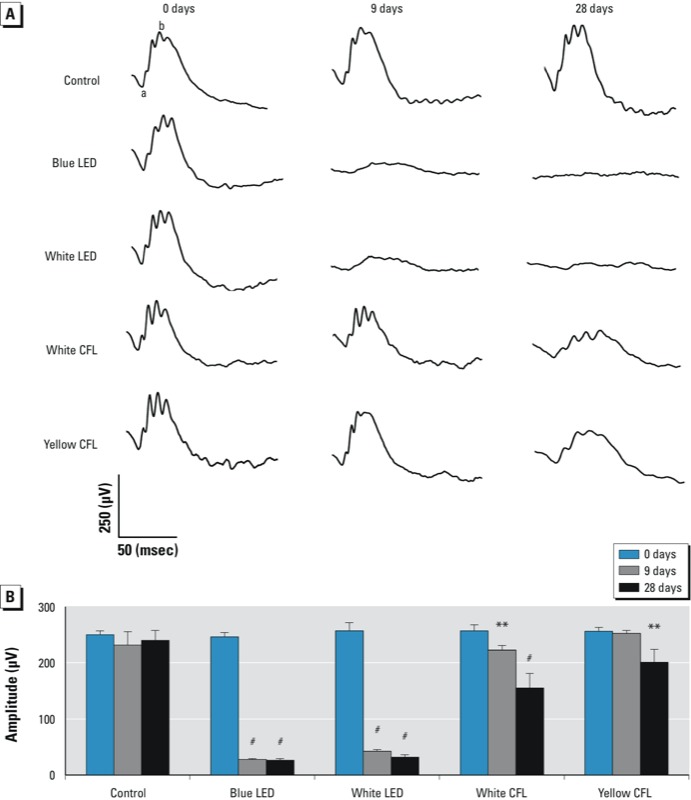
Figure 3.

Representative ERG responses (A) and ERG b‑wave amplitude (B) in unexposed (control) rats or rats exposed to blue LED, white LED, white CFL, or yellow CFL at 0 (baseline), 9, or 28 days of light exposure. Values shown in (B) are mean ± SD (for each time point, n = 3 controls and 8 for each light-exposure group at each time point. **p < 0.01, and #p < 0.001, compared with the control group by ANOVA and Tukey post hoc test.
