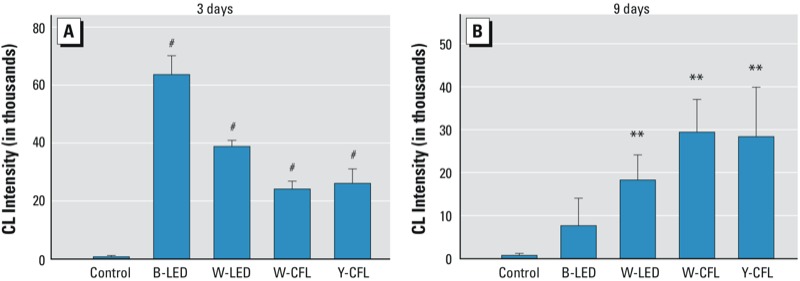
Figure 8.

ROS assay performed in control rats and rats exposed to blue LED, white LED, white CFL, or yellow CFL for 3 days (A) or 9 days (B). Values are presented as mean ± SD chemiluminescence (CL) intensity. Abbreviations: B, blue; W, white; Y, yellow. (A) After 3 days of exposure to blue LED light, lucigenin-stimulated O2•– exceeded 60,000 in total count, the white LED group had a high total count near 40,000, and the CFL groups had total counts of 20,000–30,000; At this time point, control rats exhibited a count of approximately 1,000. n = 3 controls, and n = 3 for each exposure group. (B) After 9 days of exposure, the O2•– total count for the blue LED light group decreased to 8,000, that for the white LED light group decreased to 18,000, and that for both fluorescent light groups remained at the same level. n = 3 controls, and n = 8 for each exposure group. **p < 0.01, and #p < 0.001, compared with the control group by ANOVA and the Tukey post hoc test.
