
Figure 1.
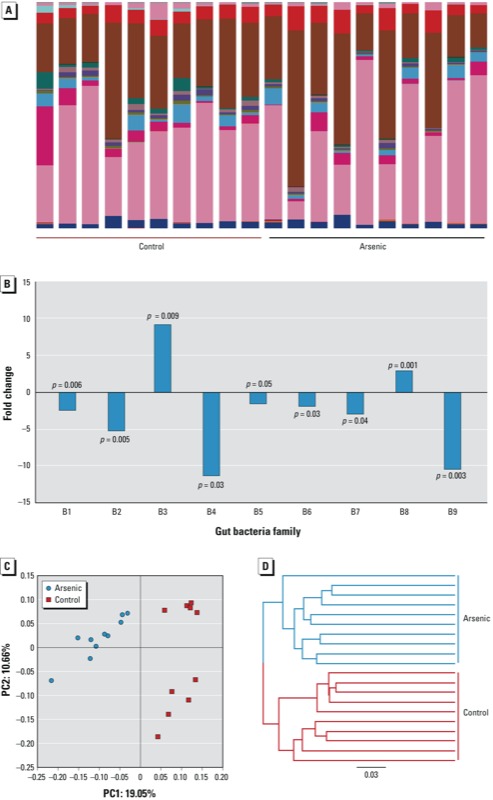
(A) The gut microbiome composition profiles at the family level in the control and arsenic-treated mice revealed by 16S rRNA sequencing (each color represents one bacterial family). (B) The fold changes and taxa assignments of significantly perturbed gut bacteria in arsenic-treated mice compared with controls [Abbreviations: c, class; f, family; o, order; p, phylum; and family abbreviations: B1 (Other;Other;Other;Other); B2 (p_Cyanobacteria;c_Chloroplast;o_Streptophyta;f_unassigned); B3 (p_Firmicutes;c_Bacilli;o_Bacillales;Other); B4 (p_Firmicutes;c_Clostridia;Other;Other); B5 (p_Firmicutes;c_Clostridia;o_Clostridiales;f_unassigned); B6 (p_Firmicutes;c_Clostridia;o_Clostridiales;f_Catabacteriaceae); B7 (p_Firmicutes;c_Clostridia;o_Clostridiales;f_Clostridiaceae); B8 (p_Firmicutes;c_Clostridia;o_Clostridiales;f_Clostridiales Family XIII Incertae Sedis); B9 (p_Tenericutes;c_Erysipelotrichi;o_Erysipelotrichales;f_Erysipelotrichaceae).] (C) The gut microbiome patterns of control and arsenic-treated mice differentiated by principal coordinate analysis. (D) Hierarchical clustering analysis by UPGMA indicates that controls and arsenic-treated mice clustered in their own groups, with the UPGMA distance tree constructed at a distance of 0.03.