
Figure 3.
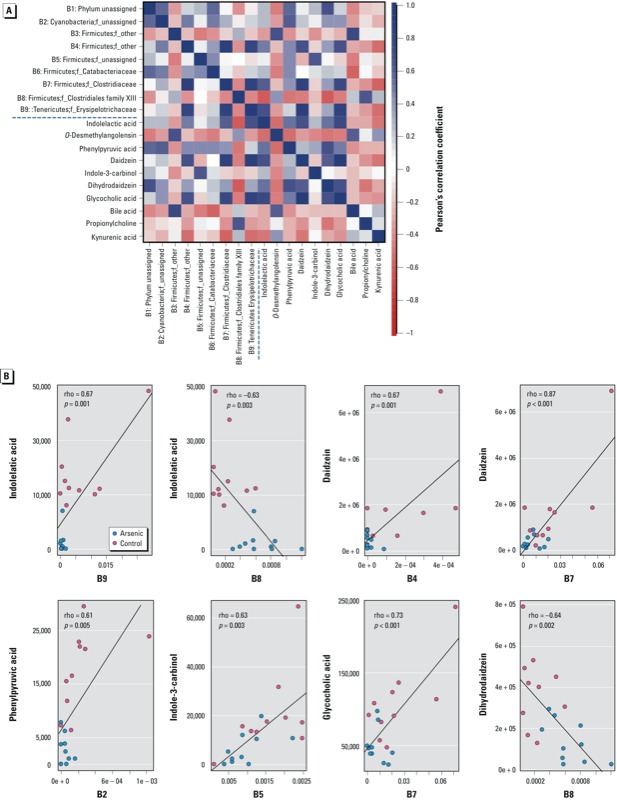
(A) Correlation plot showing the functional correlation between perturbed gut bacteria families and altered fecal metabolites. (B) Scatter plots illustrating statistical association between the relative abundance of altered gut bacteria families and the mass spectrum intensities of some typical gut microflora–related metabolites, including indole-containing compounds, isofavone metabolites, and bile acids.