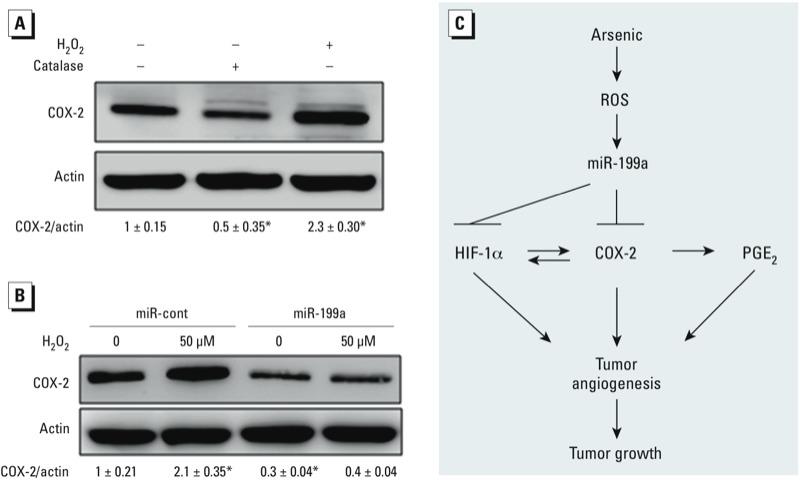
Figure 6.

Excessive ROS is an upstream signal of miR-199a/COX-2 pathway in AsT cells. (A) AsT cells were treated with catalase (1,500 U) or H2O2 (50 μM) for 12 hr, followed by Western blotting analysis. Bottom: quantification from three independent experiments using densitometry. (B) AsT cells stably expressing control or miR-199a were treated with H2O2 (50 μM) for 12 hr. COX-2 expression levels were determined by Western blotting analysis. Bottom: quantification from three independent experiments using densitometry. Student’s t-test was used to determine the difference. (C) Schematic diagram for proposed pathway. *p < 0.05, compared with control.
