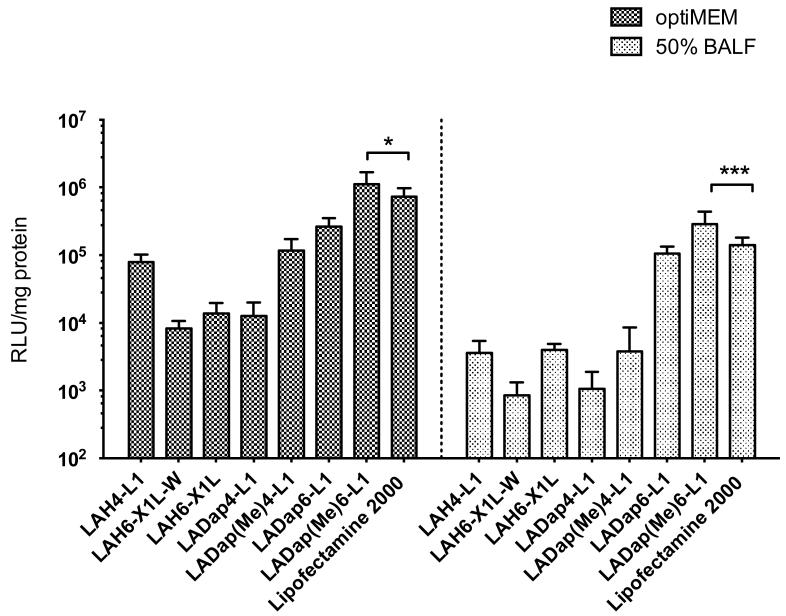
Fig. 2. DNA transfection of A549 cells mediated by pH responsive peptides in OptiMEM-1 or 50% BALF.
Each well of a 24-well plate contained 1 μg of luciferase plasmid DNA. Lipofectamine™ 2000 was used as control. Transfection efficiency and protein level were evaluated at 48 h post-transfection. Transfection efficiency expressed as relative light unit (RLU)/mg protein. Bars shown as mean ± standard deviation (n = 6). Significance difference was determined using one way ANOVA analysis followed by Bonferroni’s post test. *p < 0.05, ***p < 0.001.

