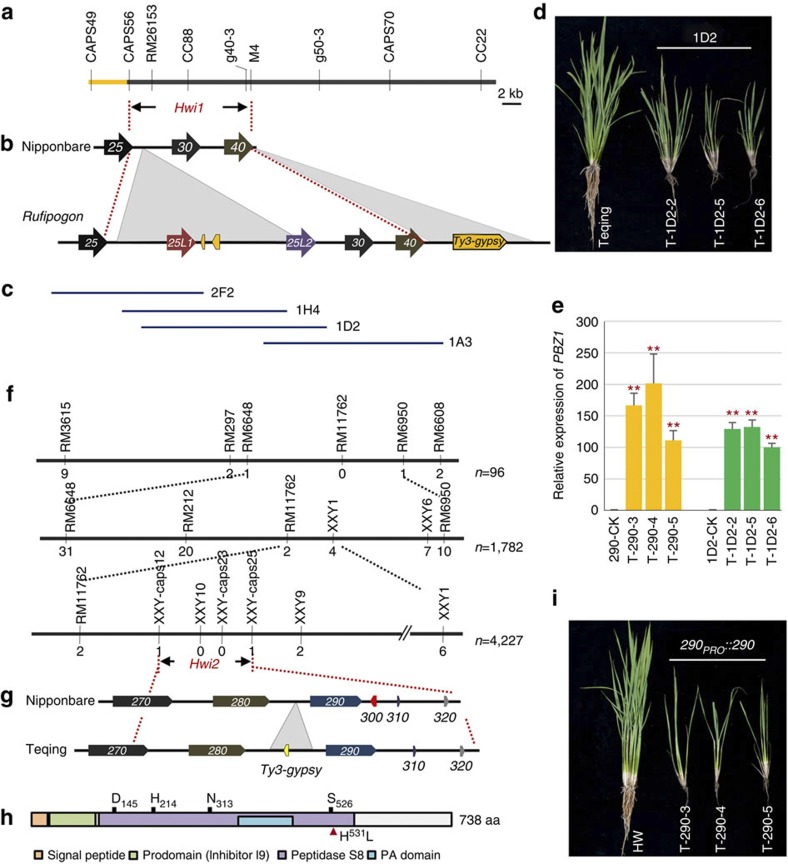
Figure 2. Map-based cloning and genetic complementation of Hwi1 and Hwi2.
(a) Gene location of Hwi1. (b) Diagram of SVs within the candidate region between Nipponbare (Oryza sativa) and wild rice (Oryza rufipogon). Arrows indicate the candidate genes. The last two digits of LOC_Os072XX gene identifiers are given for each gene. Insertions in wild rice are indicated with grey triangles. Transposable elements or their remains are indicated with yellow pentagons. (c) Segments derived from a Hainan wild rice BAC clone used for complementation tests. (d) Independent transformants carrying 1D2 fragment in Teqing express weakness syndrome. (e) The expression levels of PBZ1 in different transgenic lines. Yellow and green colours indicate 290PRO::290 and 1D2 transformants, respectively. **indicates significant difference between the transgenic plants and the corresponding control determined by the t-test at P<0.01. Error bars indicate s.d., n=3. (f) Fine mapping of Hwi2. Black bars and vertical lines indicate the chromosome and polymorphic markers, respectively. Individual numbers for mapping are listed to the right of the chromosome diagram. Numbers under markers indicate the recombinants identified between the marker and Hwi2. (g) Schematic diagram of Hwi2 candidate region in Nipponbare and Teqing. Genes are indicated with pentagons. The last three digits of LOC_01g58XXX gene identifiers are given for each gene. Insert is indicated with a grey triangle. (h) Protein structure of LOC_Os01g58290 encoded subtilisin-like protease. D145, H214, N313 and S526 are conserved amino-acid residues of the catalytic triads. Red triangle indicates the functional mutation H531L. (i) Independent transformants with Teqing Hwi2 in the HW line induced the expression of hybrid weakness.

