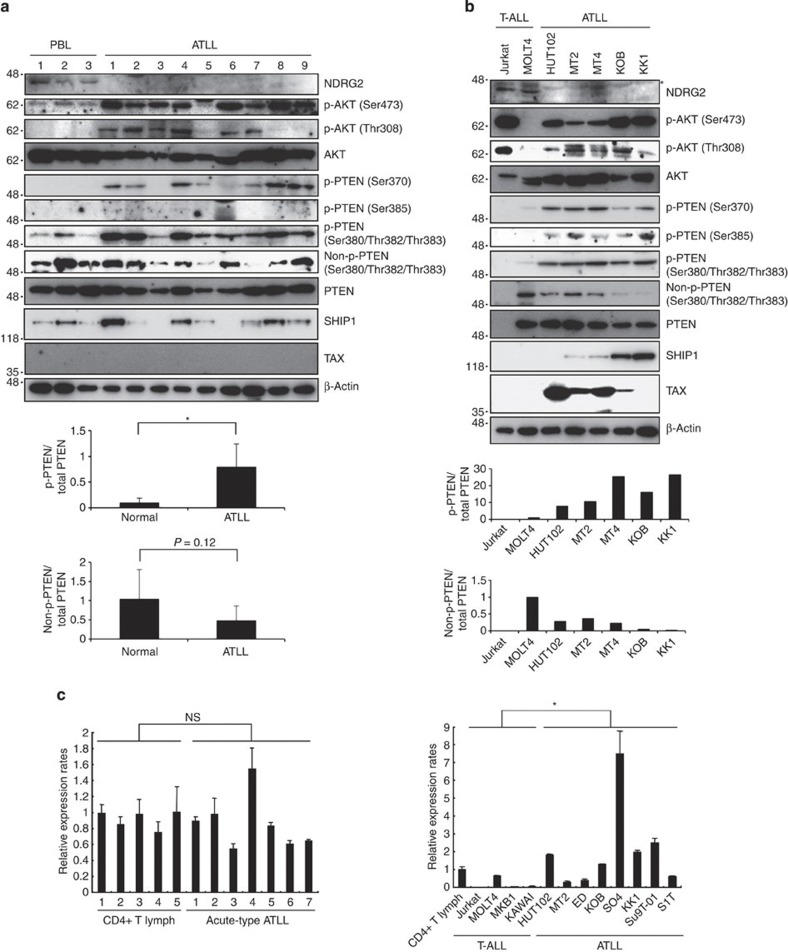
Figure 2. The PI3K-AKT signalling pathway is activated in ATLL cells.
(a) A western blot analysis of NDRG2, PTEN, phosphorylated PTEN (p-PTEN) (Ser370, Ser380/Thr382/Thr383 and Ser385), non-p-PTEN (Ser380/Thr382/Thr383), SHIP1, AKT, p-AKT (Ser473 and Thr308) and Tax was performed in primary leukaemic cells from acute-type ATLL patients. The CD4+ T lymphocytes from healthy volunteers (CD4+ T lymph) served as the controls. No expression of Tax was detected in CD4+ T lymphocytes from healthy volunteers or ATLL cells from acute-type ATLL patients. The graph shows relative band intensity of p-PTEN (Ser380/Thr382/Thr383) and non-p-PTEN (Ser380/Thr382/Thr383). Each p-PTEN or non-p-PTEN value was divided by the total PTEN value for a given sample. The data are expressed as the mean value±s.d. (*P<0.05, Student’s t-test). The data are representative of three experiments. (b) A western blot analysis with the same antibodies as in Fig. 2a was performed in the T-ALL and ATLL cell lines. Asterisk, nonspecific band. HTLV-1-transformed T-cell lines (HUT102, MT2 and MT4) expressed high levels of Tax. The graph shows relative band intensity of p-PTEN (Ser380/Thr382/Thr383) and non-p-PTEN (Ser380/Thr382/Thr383). Each p-PTEN or non-p-PTEN value was divided by the total PTEN value for a given sample. The data are representative of three experiments. (c) Quantitative RT–PCR analysis of PTEN in CD4+ T lymphocytes from five healthy volunteers and ATLL cells from seven acute-type ATLL patients, along with four T-ALL cell lines and eight ATLL cell lines. The relative amounts of mRNA were normalized against β-actin mRNA and expressed relative to the mRNA abundance in healthy control sample 1. The mean±s.d. is shown; *P<0.05; NS, not significant (Mann–Whitney U-test). The data are representative of two experiments.

