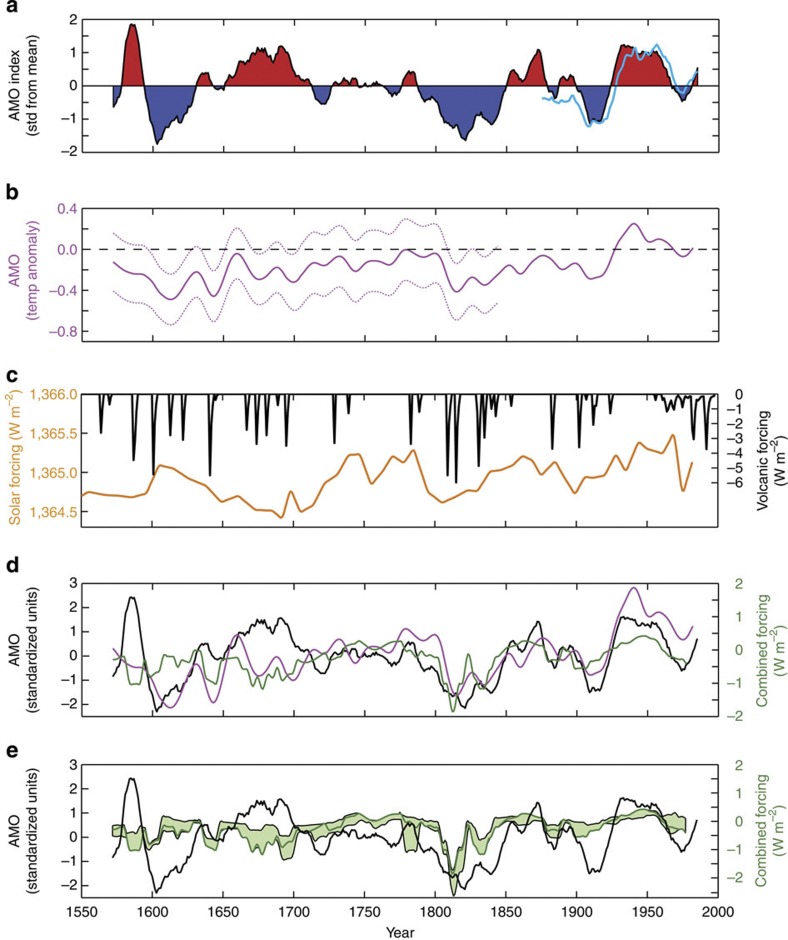
Figure 1. Past AMO variability and changes in solar and volcanic forcing.
(a) Tree-ring-based AMO reconstruction4 (black line and red/blue fill) and the North Atlantic SST anomaly calculated from instrumental data56 (light blue line; scaled and subjected to an 11-year running mean). (b) A multiproxy-based AMO reconstruction and associated uncertainties24. (c) Changes in TSI28 (orange line) and volcanic forcing30 (black line). (d) Comparison between the tree-ring4 (black) and multiproxy24 (magenta) AMO reconstructions (standardized units) and changes in the combined solar and volcanic forcing based on the solar reconstruction of Delaygue and Bard28 and the volcanic reconstruction of Crowley30 (dark green line). (e) Comparison between the AMO reconstruction4 based on tree-rings (black line) and the external forcing envelope (light green shading) encompassing three different reconstructions of solar28,31,32 and volcanic30,33,34 forcing, respectively.

