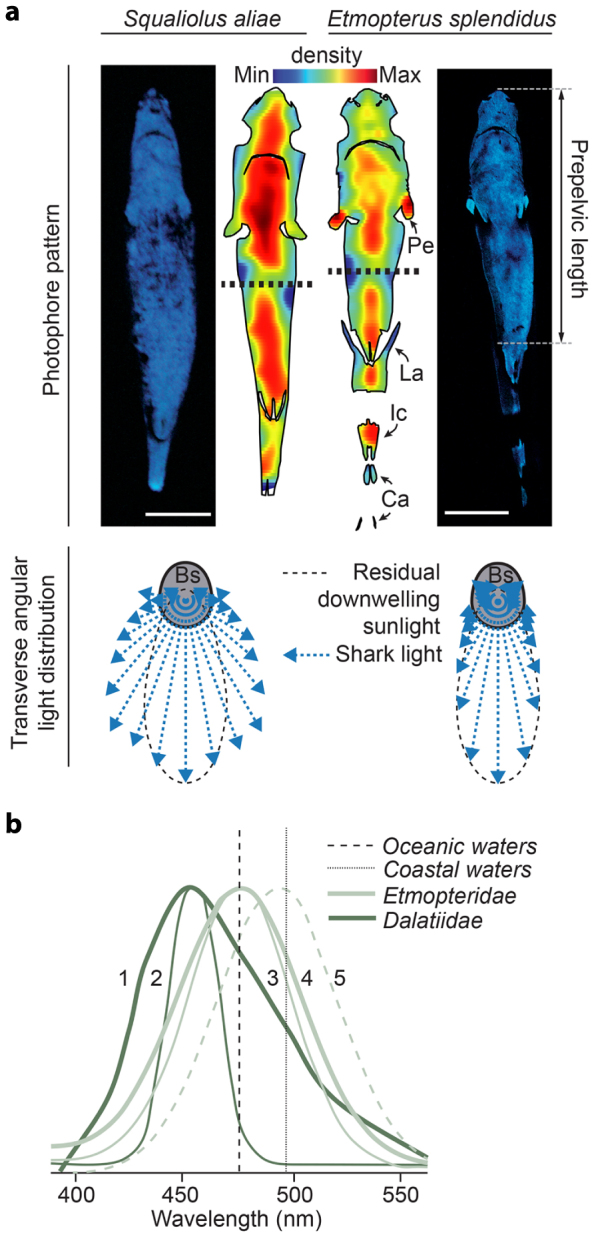
Figure 2. Physical characteristics of shark luminescence.

(a) Photophore density maps from the dalatiid S. aliae and the etmopterid E. splendidus (horizontal dashed lines indicate anterior and posterior wholemount connections with adjacent low-density artefact) with associated in vivo luminescence and transverse angular distribution (blue vectors indicate the intensity of luminescence in selected directions). Bs, body section at 0.5 prepelvic length. Luminous zone abbreviations same as in Fig. 1. Scale bars, 2 cm. (b) Dalatiid and etmopterid emission spectra (new data combined with published spectra18,31) compared to published peak emission wavelength of mesopelagic coastal18 and oceanic32 waters: 1, I. brasiliensis (λmax = 455 nm); 2, S. aliae (λmax = 457 nm); 3, E. splendidus (λmax = 476 nm); 4, E. molleri (λmax = 477 nm); 5, E. spinax (λmax = 486 nm). Photographs by Mallefet. Drawings by Claes.
