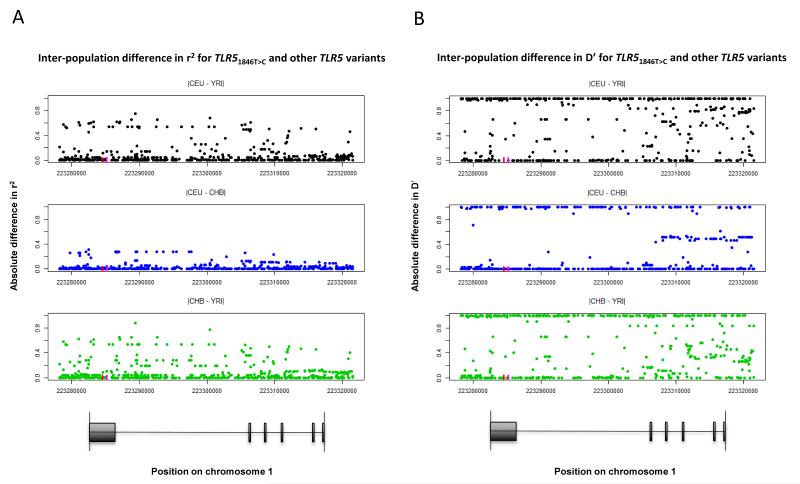
Figure 5. Population differences in TLR51846T>C LD structure.
(A) r2 and (B) D′ was calculated for TLR51846T>C and each of 733 polymorphic sites in the TLR5 gene region from Phase 1 1000 Genomes data for Utah residents with ancestry from northern and western Europe (CEU), Yoruban (YRI) and Han Chinese (CHB) populations. The pairwise difference in these LD measures for each population pair is shown for the 233 variants for which at least one difference was non-zero. The red line indicates the position of TLR51846T>C and the magenta line indicates the position of TLR51174C>T on chromosome 1. A map of TLR5 is shown for reference.

