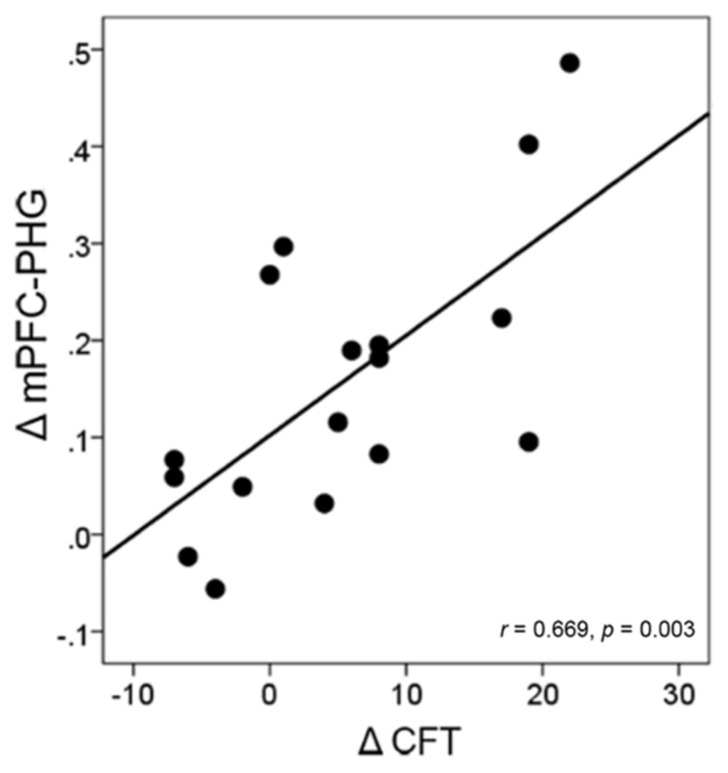
FIGURE 6.
Correlation between the change in brain connectivity and the change in cognitive performance in the intervention group. Each circular dot represents the data from one participant. The regression line indicates a positive relationship between the change in the mPFC-PHG connectivity and the change in the performance on CFT.

