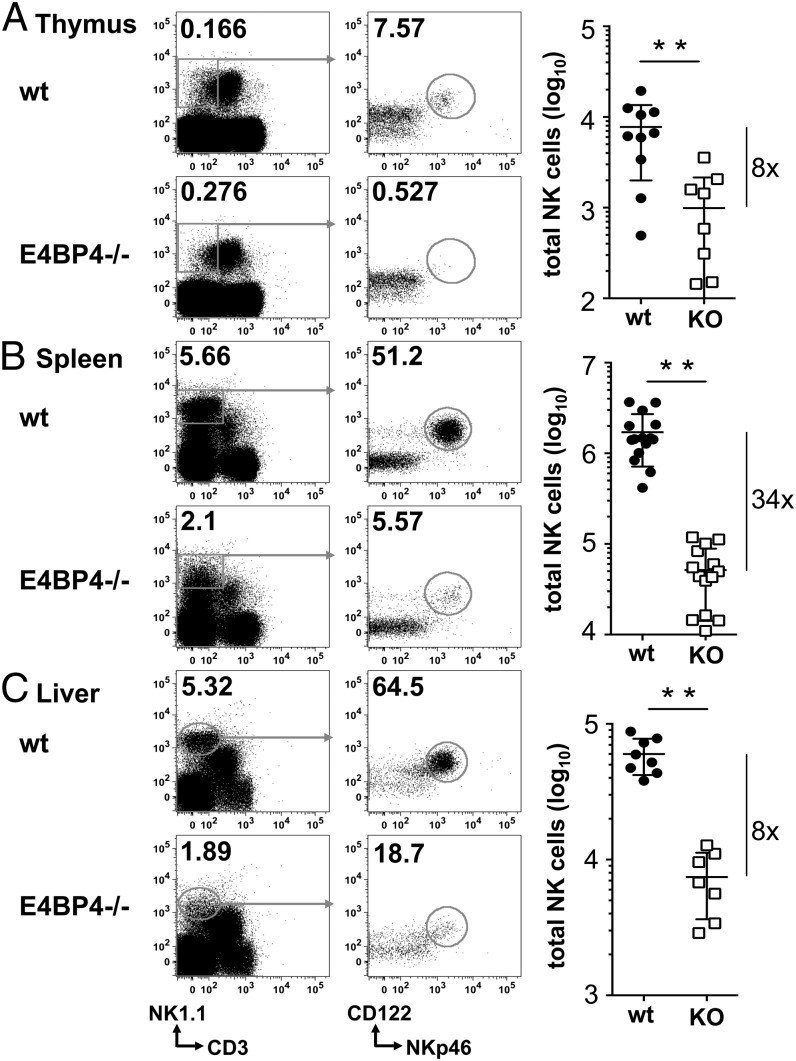
FIGURE 1.
NK frequencies and numbers are reduced in E4BP4-deficient mice. The wt and E4BP4−/− thymi (A), spleens (B), and livers (C) were analyzed for the presence of CD3−NK1.1+NKp46+CD122+ NK cells. Absolute numbers of total CD3−NK1.1+NKp46+CD122 NK cells were then calculated based on the gating strategy shown. Bars in the graph show means ± SD of replicates (n = 8–14); the fold reduction is indicated to the right. Asterisks indicate statistically significant differences (unpaired t test: **p < 0.01).

