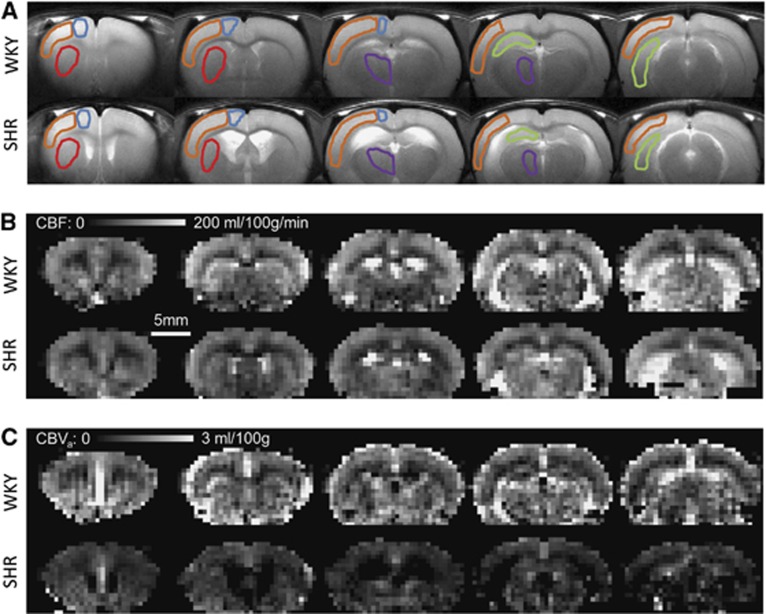
Figure 1.
Anatomic T2-weighted images (A) and quantified cerebral blood flow (CBF) (B) and cerebral arterial blood volume (CBVa) (C) maps from Wistar–Kyoto rats (WKY) and spontaneously hypertensive rats (SHR). Data from one representative animal for each group are shown. The volume of hyperintense ventricles increased in SHR. Overall, both animal models had similar CBF values, whereas SHR demonstrated smaller CBVa values than WKY. Five regions of interest were chosen in both hemispheres, but overlaid on one hemisphere in the anatomic images; sensory cortex—orange; motor cortex—blue; caudate putaman—red; thalamus—purple; hippocampus—green.

