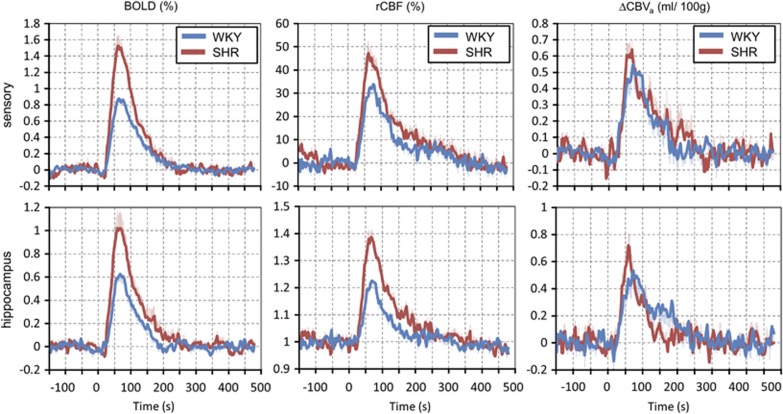
Figure 4.
Group-averaged blood-oxygenation-level-dependent (BOLD) (left), relative cerebral blood flow (rCBF) (middle) and cerebral arterial blood volume (ΔCBVa) (right) responses of the sensory (upper) and the hippocampus area (lower) to CO2 stimulation. The dynamics of BOLD and ΔCBF were similar, but their peak response was much higher for spontaneously hypertensive rats (SHR). The ΔCBVa responses in SHR appeared to have a slightly shorter time-to-peak and faster return with similar amplitude of signal changes. Error bars: s.e.m.. WKY, Wistar–Kyoto rats.

