Figure 2.
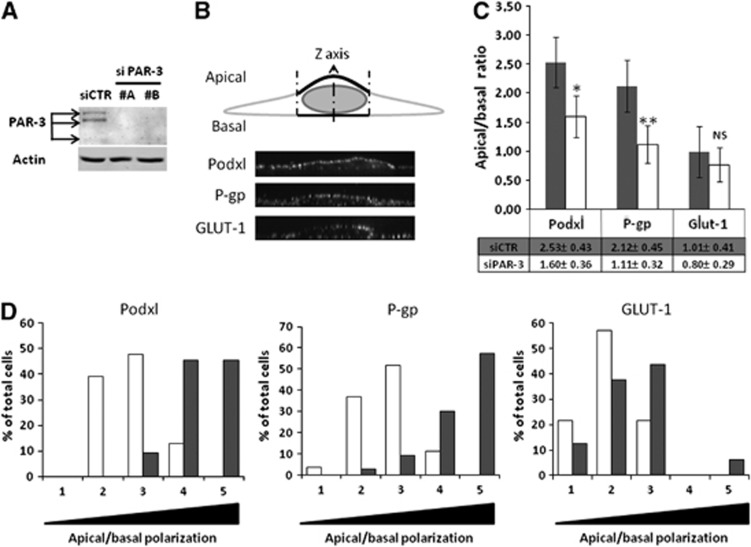
The Par/aPKC planar cell polarity complex controls hCMEC/D3 cells polarization. (A) Immunoblot analysis of PAR-3 and actin expression. hCMEC/D3 cells were treated with control small interfering RNA (si CTR) or two distinct siRNAs against PAR-3 (#A, #B). Cells were grown at confluence and whole-cell lysates were generated. Proteins were separated on sodium dodecyl sulfate polyacrylamide gel electrophoresis gel followed by immunoblotting with anti-PAR-3 or anti-actin monoclonal antibodies. (B) Cell membranes were stained using CM-dil then cells were fixed and permeabilized. Immunostaining was performed using Podxl or P-gp monoclonal antibodies or a GLUT-1 polyclonal antibody. Nuclei were labeled with DAPI. Membranous immunofluorescence intensity was evaluated along cells Z-axis above and below the nucleus using ImageJ software and curve was generated using KaleidaGraph software. Apical or basal fluorescence intensity was calculated by integrating area under apical or basal peak defined by membrane labeling with CM-dil. (C) HCMEC/D3 cells treated with control siRNA (gray bars) or PAR-3 siRNA (#A) (white bars) were grown at confluence for 6 days on culture inserts. Mean apical/basal fluorescence intensity of 40 different cells from three independent experiments was calculated. Indicated P values were obtained using Student's t-test: *P<0.005; **P<0.001; NS, not significant. (D) Cell repartition in percent between apical/basal ratio range divided in five equal categories (gray: siCTR; white: siPAR-3). Category 1 includes cells with lower apical/basal ratio (0 to 0.5) to category 5, which includes cells with higher apical/basal ratio (2 to 2.5).

