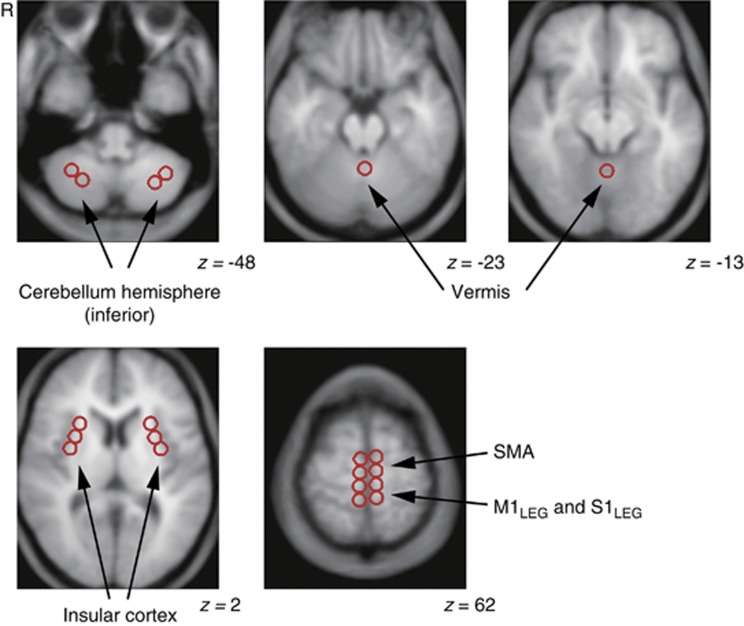
Figure 2.
Representative images showing distributed regions of interest. Multiple circular areas, 10 mm in diameter, were placed on the magnetic resonance imaging (MRI) averaged from 10 images from each subject's co-registered positron emission tomography –MRI image, which was resliced at a thickness of 5 mm. The Montreal Neurological Institute coordinate in the z dimension is given for each slice. R indicates right side of the brain. M1Leg, primary motor cortex for legs; SMA, supplementary motor cortex; S1Leg, primary sensory cortex for legs.

