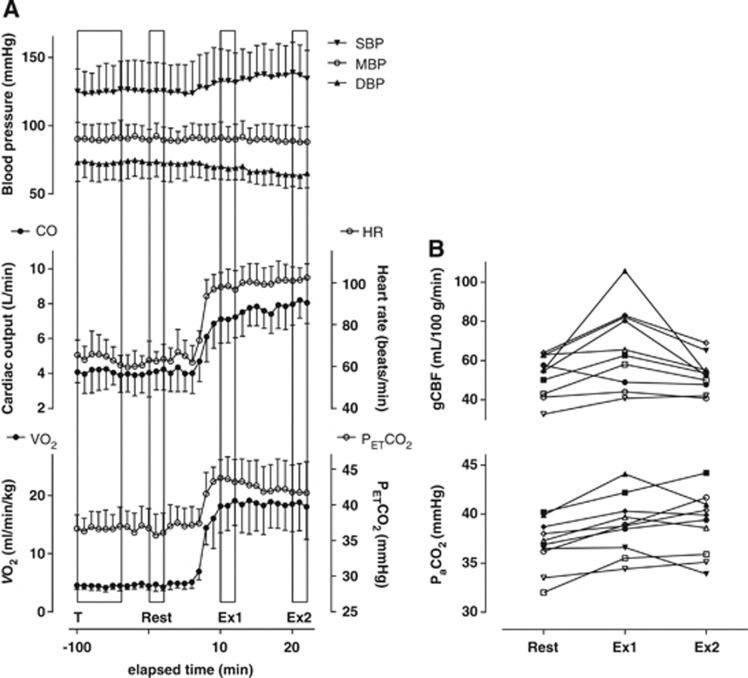
Figure 3.
Changes in the indicated physiologic parameters and quantitative gCBF during moderate, steady-state cycling exercise. (A) Time course of the indicated physiologic parameters. Boxes indicate the transmission scan (T), emission scans of the Rest, Ex1, and Ex2 periods. Injection time of oxygen-15-labeled water for the first positron emission tomography (PET) scan was defined as Time 0. Each data point represents the mean±s.d. of a 1-minute epoch (n=10). (B) Individual results for arterial CO2 (PaCO2) and global cerebral blood flow (gCBF) at Rest, Ex1, and Ex2. Each symbol represents an individual subject. DBP, diastolic blood pressure; HR, heart rate; MBP, mean blood pressure; SBP, systolic blood pressure; VO2, pulmonary oxygen consumption.

