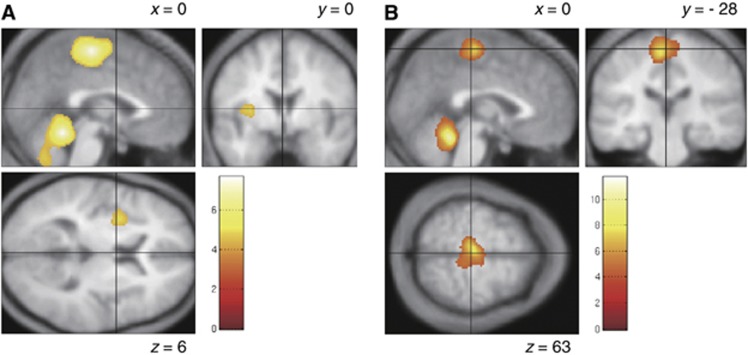
Figure 4.
Brain regions showing higher regional cerebral blood flow at Ex1 (A) and Ex2 (B) than at Rest. Areas of significant common activation above P<0.001 are color-scaled according to the T score (scale given in the Figure). Group data are presented on an averaged T1-weighted structural image derived from the 10 subjects and normalized to the Montreal Neurological Institute (MNI) standard space. Montreal Neurological Institute coordinates in the x dimension and y dimension are given for parasagittal and coronal slices, respectively.

