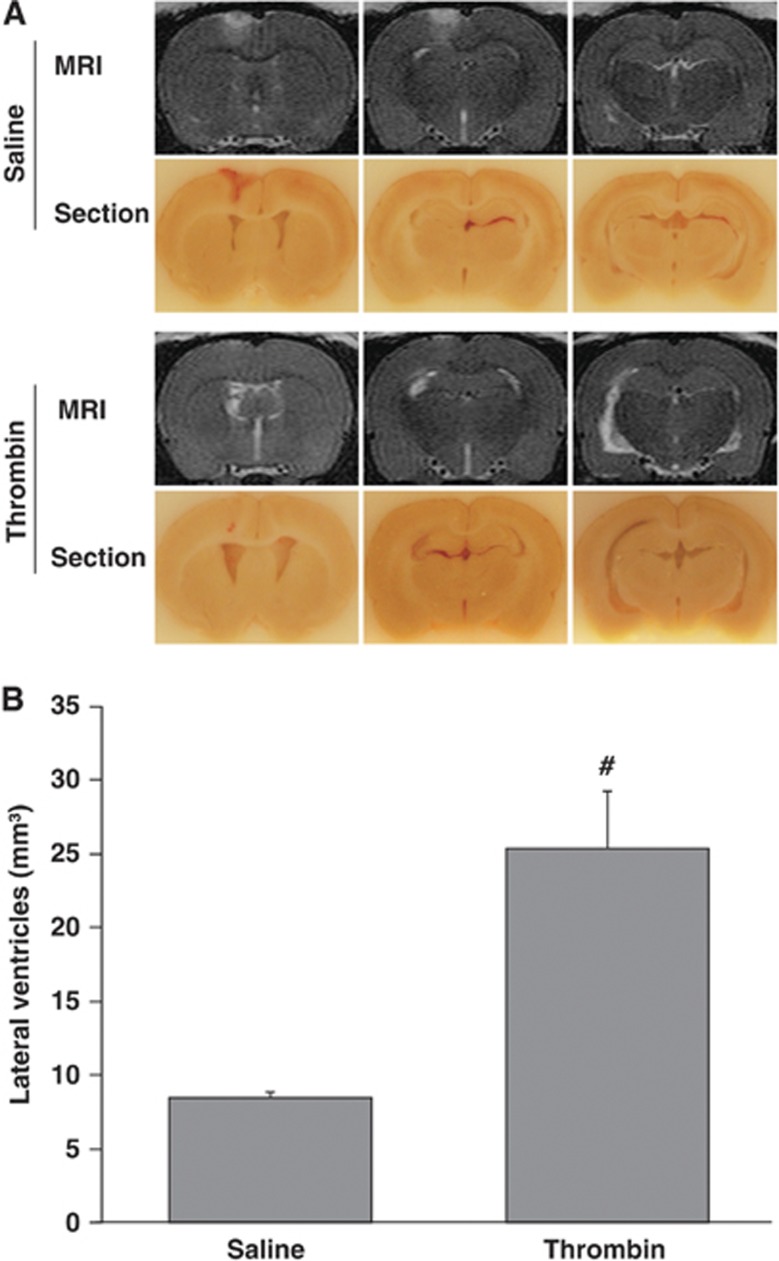
Figure 2.
Intraventricular injection of thrombin caused hydrocephalus. T2-weighted MRI and frozen coronal brain sections (A) and the measurement of ventricular volume with T2-weighted MRI (B) at 24 hours after injection of 50 μl of saline or thrombin (3U) into the right lateral ventricle. Values are expressed as the means±s.d., n=6, #P<0.01 versus saline group.

