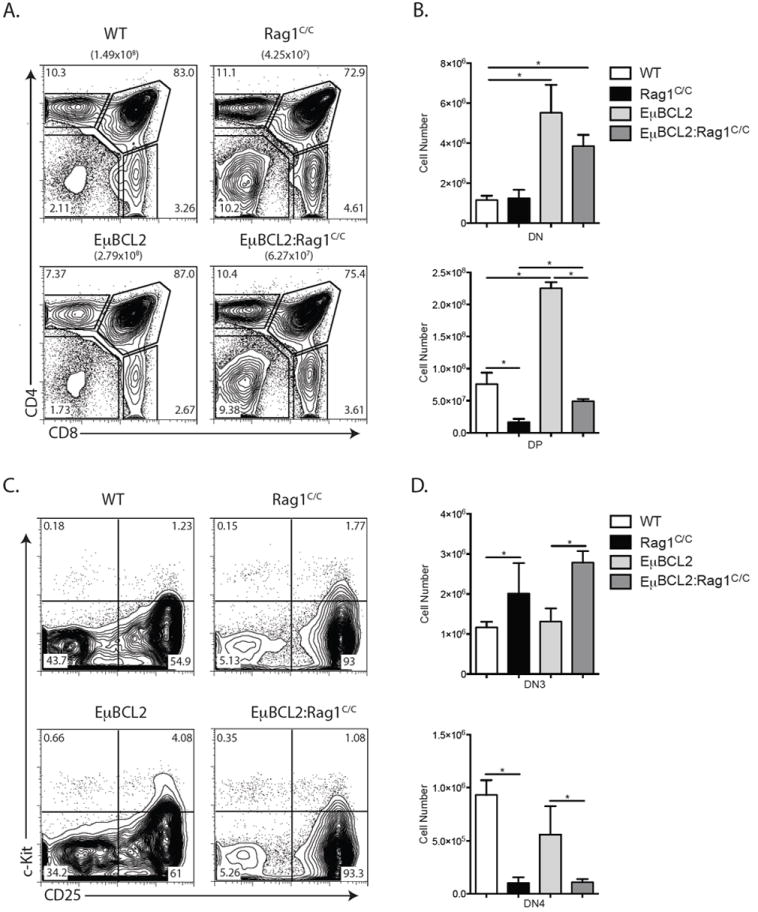
FIGURE 1.

Transgenic BCL2 expression partially rescues αβ T cell development in Rag1C/C mice. A. Representative flow cytometry analysis of CD4 and CD8 expression on total thymocytes isolated from littermate or age-matched WT (n=3), Rag1C/C (n=3), EμBCL2 (n=3), or EμBCL2:Rag1C/C (n=3) mice. The average number of total thymocytes for mice of each genotype is indicated in parentheses, and the frequencies of cells in the DN, DP, CD4+ SP, and CD8+ SP quadrants are indicated on the plots. B. Graphs showing the average numbers of DN and DP thymocytes from mice of the indicated genotypes. Error bars are standard error of the mean. Lines with asterisks above indicate significant differences (p≤0.05). A and B. This experiment was independently performed three times, each time on one mouse of each genotype. C. Representative flow cytometry analysis of c-Kit and CD25 expression on DN thymocytes isolated from littermate or age-matched WT (n=3), Rag1C/C (n=3), EμBCL2 (n=3), or EμBCL2:Rag1C/C (n=3) mice. The frequencies of DN cells in the DN1, DN2, DN3, and DN4 quadrants are indicated on the plots. D. Graphs showing the average numbers of DN3 and DN4 thymocytes from mice of the indicated genotypes. Error bars are standard error of the mean. Lines with asterisks above indicate significant differences (p≤0.05). C and D. This experiment was independently performed three times, each time on one mouse of each genotype.
