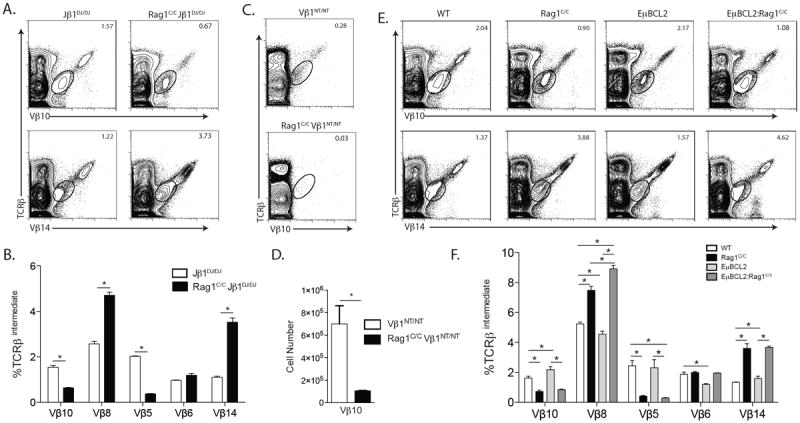
FIGURE 3.

Rag1C/C mice exhibit altered Vβ utilization in primary and secondary Vβ rearrangements. A. Representative flow cytometry analysis of TCRβ and Vβ expression shown for Vβ10 or Vβ14 on total thymocytes isolated from littermate or age-matched Jβ1DJ/DJ (n=3) and Rag1C/CJβ1DJ/DJ (n=3) mice. The frequencies of cells in the depicted TCRβintermediate gate are indicated. B. Graph showing the average frequencies of TCRβintermediate cells expressing Vβ10, Vβ8, Vβ5, Vβ6, or Vβ14 in thymocytes from Jβ1DJ/DJ and Rag1C/CJβ1DJ/DJ mice. Error bars are standard error of the mean. Lines with asterisks above indicate significant differences (p≤0.05). A and B. This experiment was independently performed three times, each time on one mouse of each genotype. C. Representative flow cytometry analysis of TCRβ and Vβ10 expression on total thymocytes isolated from littermate or age-matched Vβ1NT/NT (n=6) and Vβ1NT/NTRag1C/C (n=6) mice. The frequencies of cells in the depicted TCRβintermediate gate are indicated. D. Graph showing the average number of TCRβintermediate cells expressing Vβ10 in thymocytes from Vβ1NT/NT and Vβ1NT/NTRag1C/C mice. Error bars are standard error of the mean. The line with an asterisk above indicates a significant difference (p≤0.05). C and D. This experiment was independently performed three times, each time on at least one mouse of each genotype. E. Representative flow cytometry analysis of TCRβ and Vβ10 or Vβ14 expression on total thymocytes isolated from littermate or age-matched WT (n=3), Rag1C/C (n=3), EμBCL2 (n=3), or EμBCL2:Rag1C/C (n=3) mice. The frequencies of cells in the depicted TCRβintermediate gate are indicated. F. Graph showing the average frequencies of TCRβintermediate cells expressing Vβ10, Vβ8, Vβ5, Vβ6, or Vβ14 in thymocytes from mice of the indicated genotypes. Error bars are standard error of the mean. Lines with asterisks above indicate significant differences (p≤0.05). E and F. This experiment was independently performed three times, each time on one mouse of each genotype.
