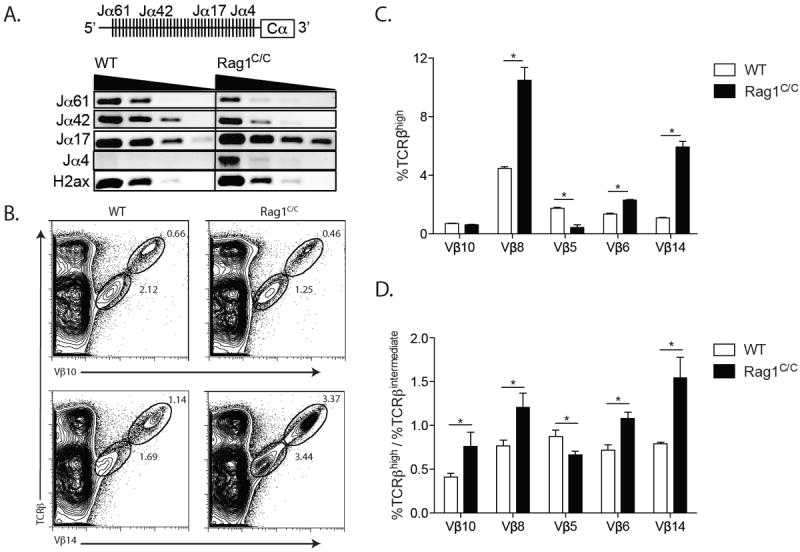
FIGURE 5.

Rag1C/C mice exhibit altered Jα utilization in Vα-to-Jα rearrangements and abnormal changes in Vβ repertoire during αβ TCR selection. A. Schematic of the Jα-Cα region of the TCRα locus (Upper). Representative PCR analysis of Vα3 rearrangements to the indicated Jα gene segments or H2ax as a loading control on 5-fold dilutions of genomic DNA from sort-purified CD4+CD8+ WT (n=3) and Rag1C/C (n=3) thymocytes (Lower). B. Representative flow cytometry analysis of TCRβ and Vβ10 or Vβ14 expression on total thymocytes isolated from littermate or age-matched WT (n=3) and Rag1C/C (n=3) mice. The frequencies of cells in the depicted TCRβintermediate and TCRβhigh gates are indicated. C. Graph showing the average frequencies of TCRβhigh cells expressing Vβ10, Vβ8, Vβ5, Vβ6, or Vβ14 in thymocytes from mice of the indicated genotypes. Error bars are standard error of the mean. Lines with asterisks above indicate significant differences (p≤0.05). D. Graph showing the average ratios of the frequencies of TCRβhigh and TCRβintermediate cells in thymocytes from WT and Rag1C/C mice. Error bars are standard error of the mean. Lines with asterisks above indicate significant differences (p≤0.05). A - D. These experiments were independently performed three times, each time on one mouse of each genotype.
