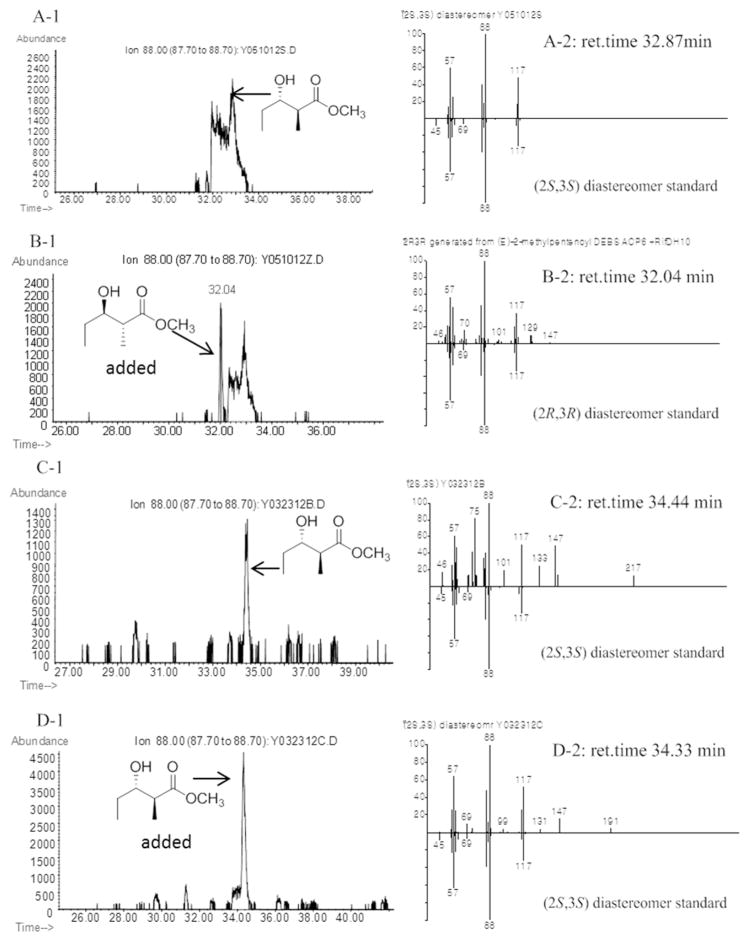
Figure 5.
Chiral GC-MS analysis (Method 4) of the incubation of (E)-2-methyl-2-pentenoyl-RifACP10-NusA with RifDH10. Left panels: Extracted ion current (XIC) at m/z 88 (base peak). Right panels, mass spectra of selected peaks corresponding to diastereomers of methyl 2-methyl-3-hydroxypentanoate, upper half, observed spectrum, lower half, inverted mass spectrum of reference standard. A and C. (2S,3S)-4a generated by RifDH10. B. A plus (2R,3R)-4b. D. C plus (2S,3S)-4a. Detailed analysis of the full mass spectra of all peaks detected in Panel A1 between 31.00 and 34.00 min showed only the presence of the single (2S,3S)-4a.

