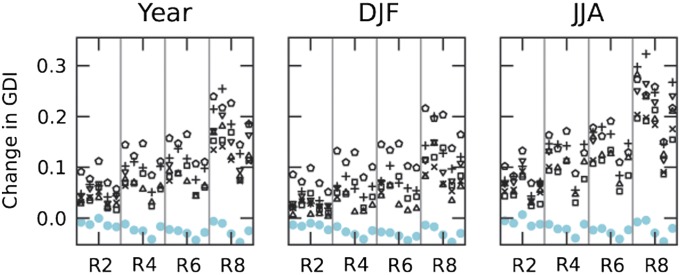
Fig. 2.
Mean change in drought severity (Change in GDI, y axis) as measured by the daily global deficit index (GDI) for the period 2070–2099 relative to 1976–2005 based on a multimodel ensemble MME experiment calculated over the whole year (Left), December to February (DJF, Center), and June to August (JJA, Right). Changes are given for each MME member and are organized by radiative forcing (from left to right: RCP2.6, R2; RCP4.5, R4; RCP6.0, R6; RCP8.5, R8). In each RCP panel, results are organized according to driving GCMs from left to right: HadGEM2-ES, IPSLCM5-ARL, MIROC-ESM-CHEM, GFDL-ESM2M, and NorESM1-M. CO2 effect in GIMs is described as color: black/open symbols, no CO2; cyan/filled symbols, CO2. GIMs are indicated by symbols: up triangle, HO8; circle, JULES; x, Mac-PDM.09; +, MPI-HM; pentagon, PRCGLOB-WB; down triangle, VIC; square, WBM.

