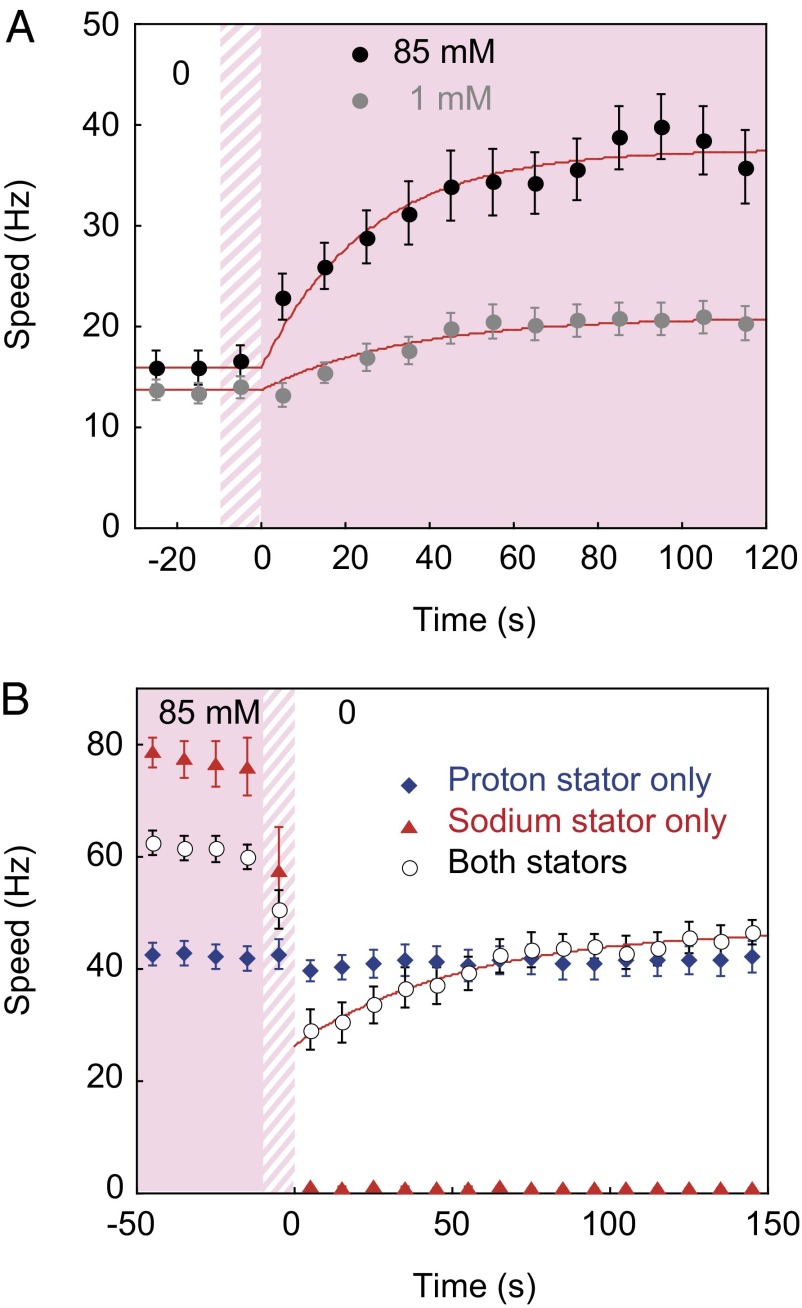
Fig. 4.
Average speed of motors vs. time after the addition (A) or removal (B) of Na+ in multiple repeats of the experiments of Fig. 3. Red lines are exponential fits. B shows responses of motors in cells expressing both types of stator (circles), H+ stator components only (diamonds), and Na+ stator components only (triangles). Data points are mean ± SEM of (A) 19 and 22 speed traces from 14 and 17 cells in 1 mM and 85 mM, respectively, and (B) 23, 16, and 15 speed traces from 18, 16, and 15 cells expressing both, H+, and Na+ stator components, respectively.

