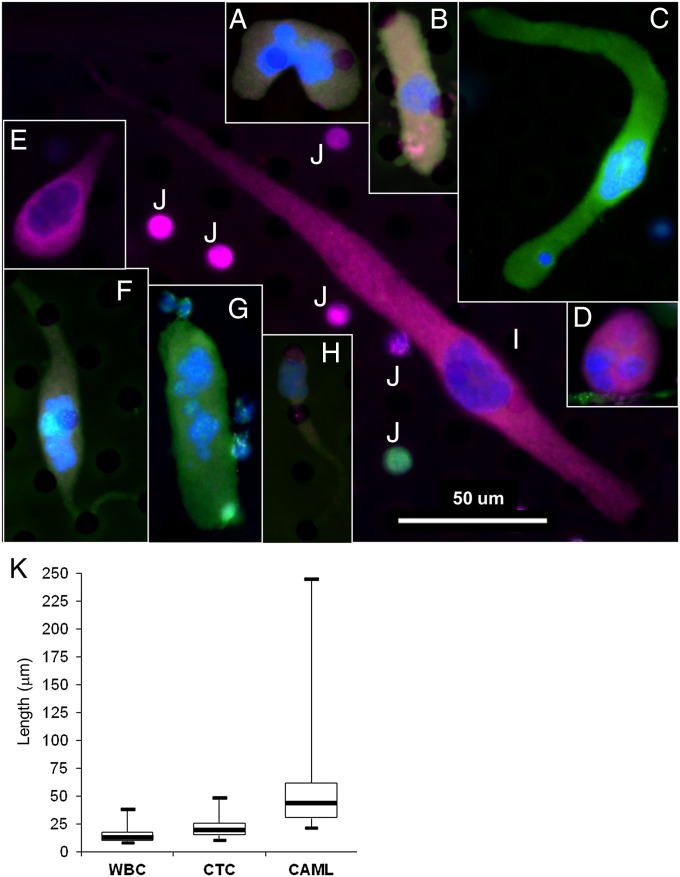
Fig. 1.
(Upper) Representative collage of the five morphologies, signal variation, and cytoplasmic diameters. (A, F, and G) Pancreatic cells. (B, C, and D) breast cells. (E, H, and I) Prostate cells. (J) Typical WBCs. Morphology variants are as follows: amorphous (A), oblong (B and G), spindle-shaped (C, F, and I), round (D), and tadpole-shaped (E and H). Color differences result from varying degrees of staining for DAPI (blue), cytokeratins (green), EpCAM (red), and CD45 (violet) (Fig. S1). (Scale bar, 50 μm.) (K, Lower) Whisker plot of cytoplasmic diameters showing diameters of WBCs, CTCs, and CAMLs (n = 75) from pooled prostate, breast, and pancreatic samples.

