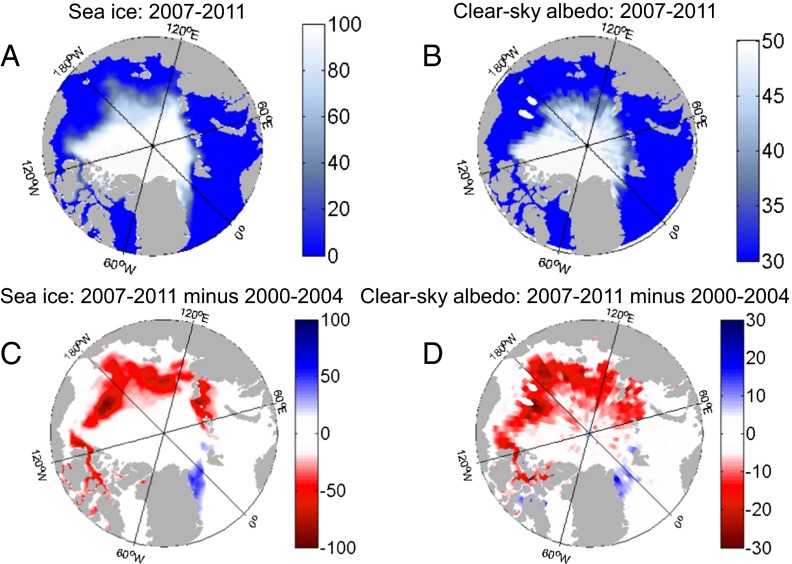
Fig. 1.
(A) Sea ice concentration and (B) CERES clear-sky albedo averaged over each September during the last 5 y of the CERES record (2007–2011) and the change in (C) sea ice and (D) clear-sky albedo between the mean of the last five Septembers (2007–2011) and the mean of the first five Septembers (2000–2004) of the CERES record. Results for other months are included in Fig. S1.

