Fig. 4.
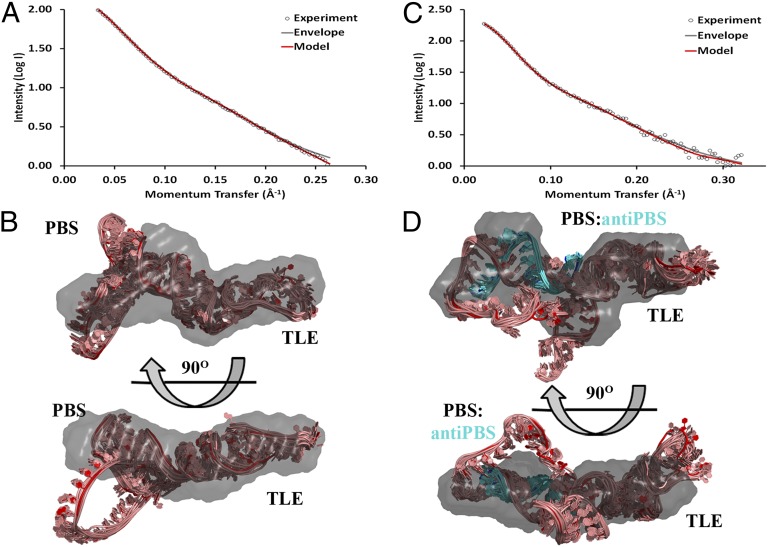
SAXS-derived ab initio envelopes and structural models of apo and annealed PBS/TLE. (A and C) Every fifth data point from SAXS experiments (open circles) was plotted along with the corresponding back-calculated scattering curves from the ab initio envelope (gray) and averaged intensity values from the 10 members of the modeled structural ensemble of PBS/TLE (red) (A) and PBS/TLE–anti-PBS (red) (C). (B and D) For both PBS/TLE (B) and PBS/TLE–anti-PBS (D), the lowest-energy model was superimposed onto the SAXS-derived ab initio envelope using SUPCOMB. The remaining ensemble models were then aligned using the superimposed lowest-energy model as a register. Envelopes are shown in a gray 40% transparent surface representation, and all-atom models are represented in pink (cyan for anti-PBS) cartoons, with the lowest-energy structure in red (blue for anti-PBS).

