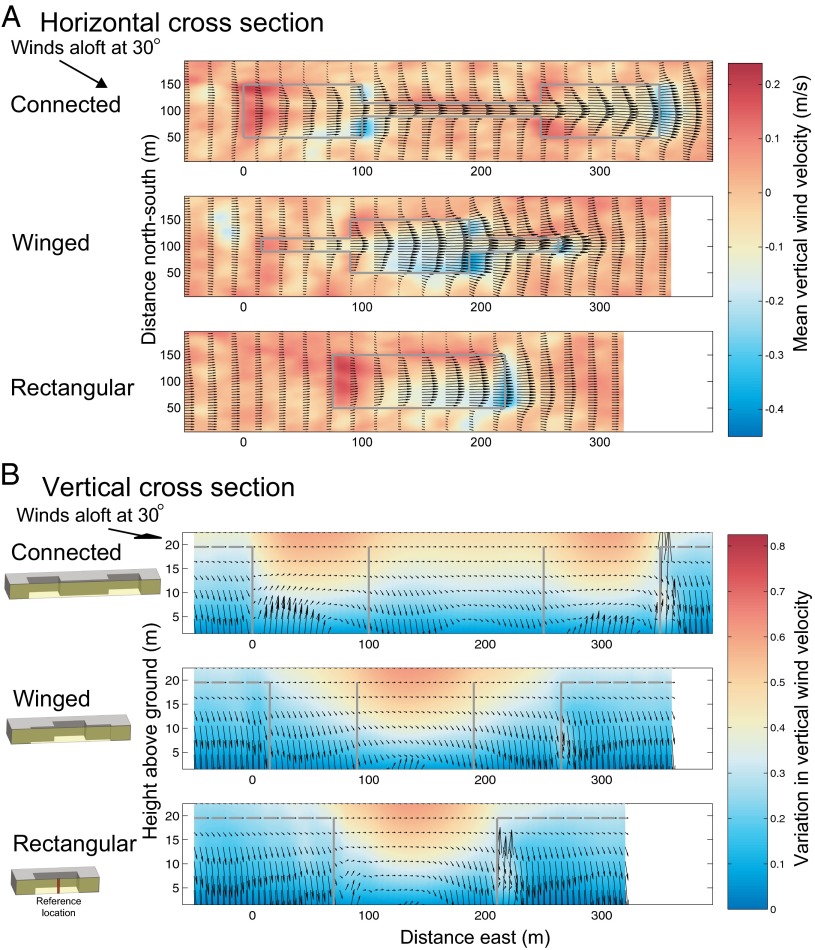
Fig. 2.
Cross-sections of wind dynamics and seed ejection probabilities when overall wind forcing aloft was 30° relative to the long axis of each patch (see SI Materials and Methods for 0°, 60°, and 90° cases). An arrow at the top left of each panel marks the mean, above-canopy wind direction. Each figure is a visualization of the results from the full simulation domain (Fig. S1) and is an average of results from two identical patches. (A) The redirecting effect (shown by arrows pointing along the major axis of the landscape structures rather than the 30° forcing wind aloft) and the bellowing effect (shown by the high wind speeds at the right end of the corridor). The horizontal cross-section below the canopy top is at 13.5 m above ground. Solid gray lines are edges of patches. The color bar shows mean vertical wind speed (red = up, blue = down). Arrows correspond to horizontal wind speeds (longer arrows indicate faster wind speeds with maximal wind speed of 2.75 m/s) and directions. (B) Ejection hotspots (shown by arrows indicating uplift probability, on a log scale, relative to the uplift probability at the same height at a reference location at the center of the rectangular patch depicted by a red solid vertical bar). Vertical cross-sections are along patch centers (yellow translucent rectangles in icons to the left of each panel depict where the vertical section was taken). Solid gray lines are patch edges and dashed gray lines are the mean canopy height of 22 m. Color bar represents the SD of vertical wind speed, where strong variation in vertical wind speed (red) creates ejection hotspots. Upward-pointing arrows mark locations where the probability is higher than the reference area, downward-pointing arrows where it is lower. A slight forward tilt for upward and backward tilt to downward arrows was added to make the arrows more easily distinguishable from each other. Details in SI Materials and Methods.

