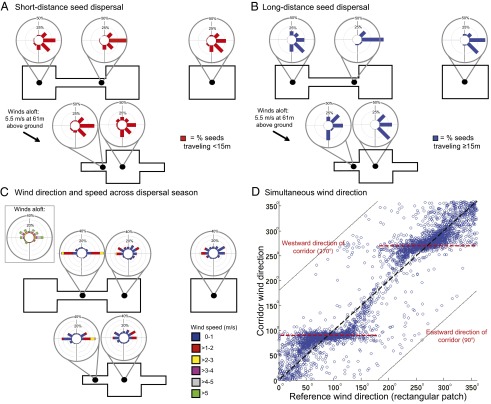
Fig. 3.
(A) Direction of short-distance seed movements from key locations (dots) within each patch. The mean directionality of seeds released in the corridor significantly differed from all other locations (Watson–Williams F tests, P ≤ 0.05). (B) Direction of long-distance seed movements from key locations (dots). Mean directionality was significantly different between the corridor and all other locations except the wing (P ≤ 0.05 and P = 0.43, respectively). (C) Wind directions and speeds over the entire dispersal season from October to December 2008 at key locations (dots) within each patch. (D) Simultaneous redirection of wind by corridors compared with reference wind conditions in the area (as measured in the center of the rectangular patch). Over a wide range of reference wind directions (40–130° and 210–300°), wind tends to orient through the corridor (90° or 270°, dashed red line). Each point represents a 30-min average of wind directions within long-term wind data collected over two dispersal seasons. The experimental landscape and data in this figure were rotated such that the long axis of the corridor is aligned along 90° and 270°, matching the simulation domain and facilitating visualization of the results (the long axis of the corridor in the field is actually aligned along 246° and 66°).

