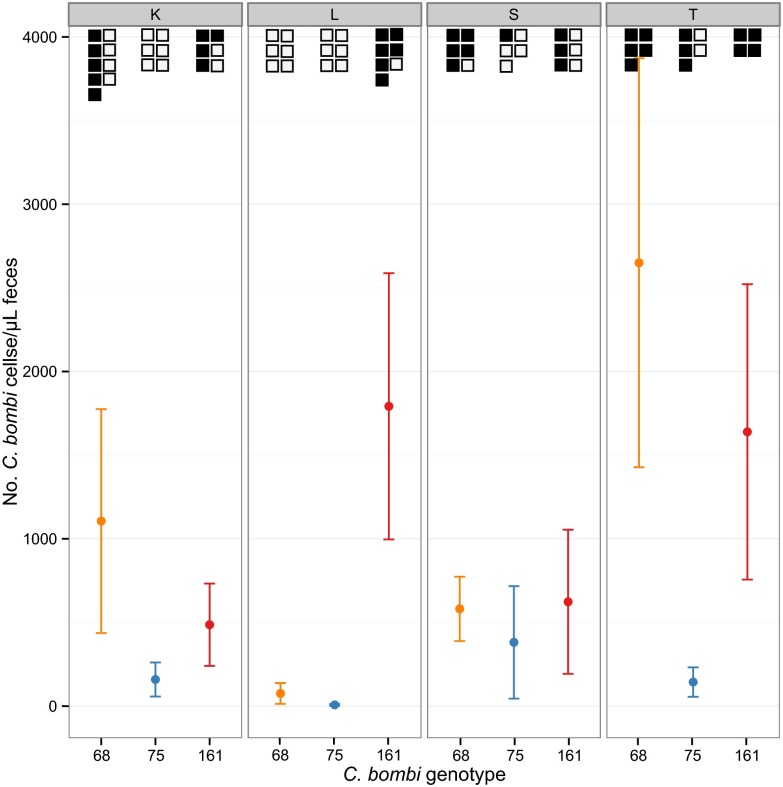
Fig. 1.
Mean number of C. bombi cells ± SE per microliter of feces according to C. bombi genotype and host genotype (colonies K, L, S, and T). The upper squares represent the number of experimentally exposed individuals checked for infection, with squares being filled if subsequent visual inspection of their feces revealed an established infection. In each panel, the x axis lists the parasite genotypes (nos. 68, 75, and 161; and are colored orange, blue, and red, respectively). Both infection intensity and whether or not an individual becomes infected varied according to the interaction between host and parasite genotypes (GH × GP intensity: F6,59 = 2.52, P = 0.031; infection: χ26,59 = 14.10, P = 0.029). Both parasite and host genotype alone significantly influenced infection success (GP: χ22,65 = 22.01, P < 0.001, GH: χ23,67 = 11.04, P = 0.012).

