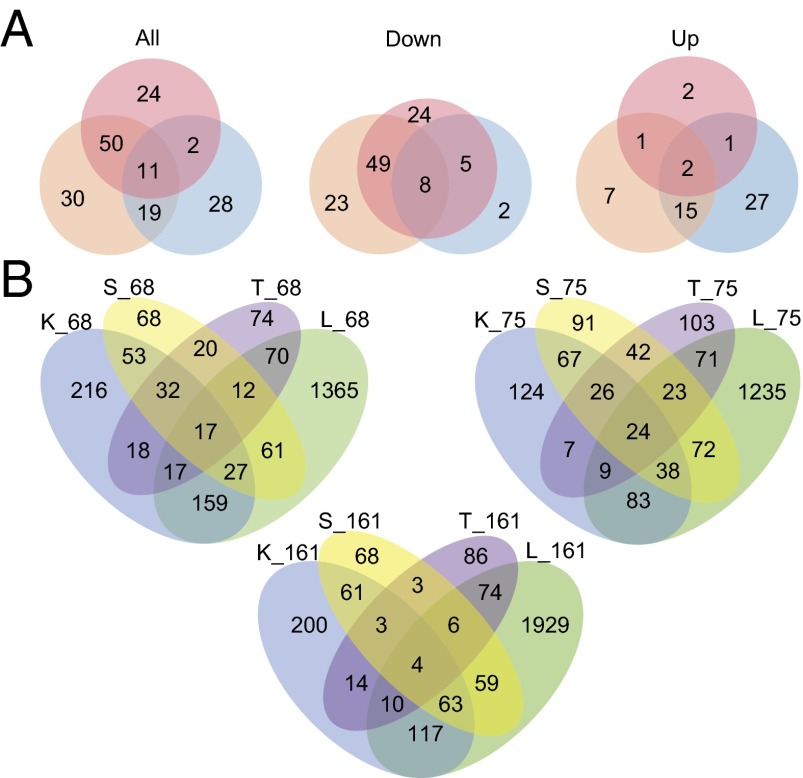
Fig. 2.
(A) Venn diagrams of the number of differentially expressed genes upon exposure to three genotypes of C. bombi relative to unexposed workers [no. 68 (orange), no. 75 (blue), and no. 161 (red)] across all host colonies at a false discovery rate of 0.05. (B) Venn diagrams of the number of differentially expressed genes (P < 0.05) when bees with different genotypes (colonies K, L, S, and T) are given the same genotype of parasite (nos. 68, 75, and 161) relative to unexposed workers from the same host genotype. For example, “S_161” indicates colony “S” exposed to parasite genotype “161.”

