
Fig. 1.

Log-log plots of metabolic rate versus mass for trees and animals show deviations from pure power law behavior. The plot suggests that the curvatures (23) in the data sets are opposite to each other. Shigeta Mori (21) provided the tree data (A), and the mammal data (B) are taken from ref. 18. The curvatures are explained as arising from the crossover of exponent values. (A) The solid line shows a fit to 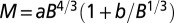 . The adjusted
  value is 0.979,
  with SE 0.220 and P value of
  , and
, and  with SE 0.0602 and P value of
  . Interestingly, one obtains a leading exponent indistinguishable from
  if one chooses to make it an adjustable parameter. (B) Motivated by the lack of consensus of the exponent associated with pure power law behavior of the metabolic rate with mass, Kolokotrones et al. (23) carried out extensive analysis of several data sets, principally one due to McNab (18), and showed that the data exhibit curvature on a log-log plot. The analysis was carried out twice, excluding and including the effects of body temperature on metabolic rate. In both cases, the authors used an empirical quadratic fit in which the logarithm of the metabolic rate was expanded in terms of the logarithms of the body mass, measured in grams. The dashed line is a fit to
  . The adjusted
  value is 0.961 comparable to the quality of fit presented in (23),
  with SE
  and P value of
  , and
, and  with SE 0.162 and P value of
  .
.